TL;DR — the 30-second version
• Unit economics ask one question: do you make more from a customer than it costs to win and serve them?
• CAC = total sales + marketing spend ÷ new customers. LTV = (yearly revenue per customer × gross margin) ÷ churn rate.
• The number investors care about: LTV ÷ CAC. Aim for 3:1 or higher. Below 1:1 means you lose money on every customer.
• CAC payback = how many months to earn back what you spent. Under 12 months is healthy; under 6 is excellent.
• India reality (FY 2025-26): B2B SaaS CAC runs Rs 1.2 lakh to Rs 5 lakh, with payback often 10-20 months. Lower ACVs make the maths tighter than US guides admit.
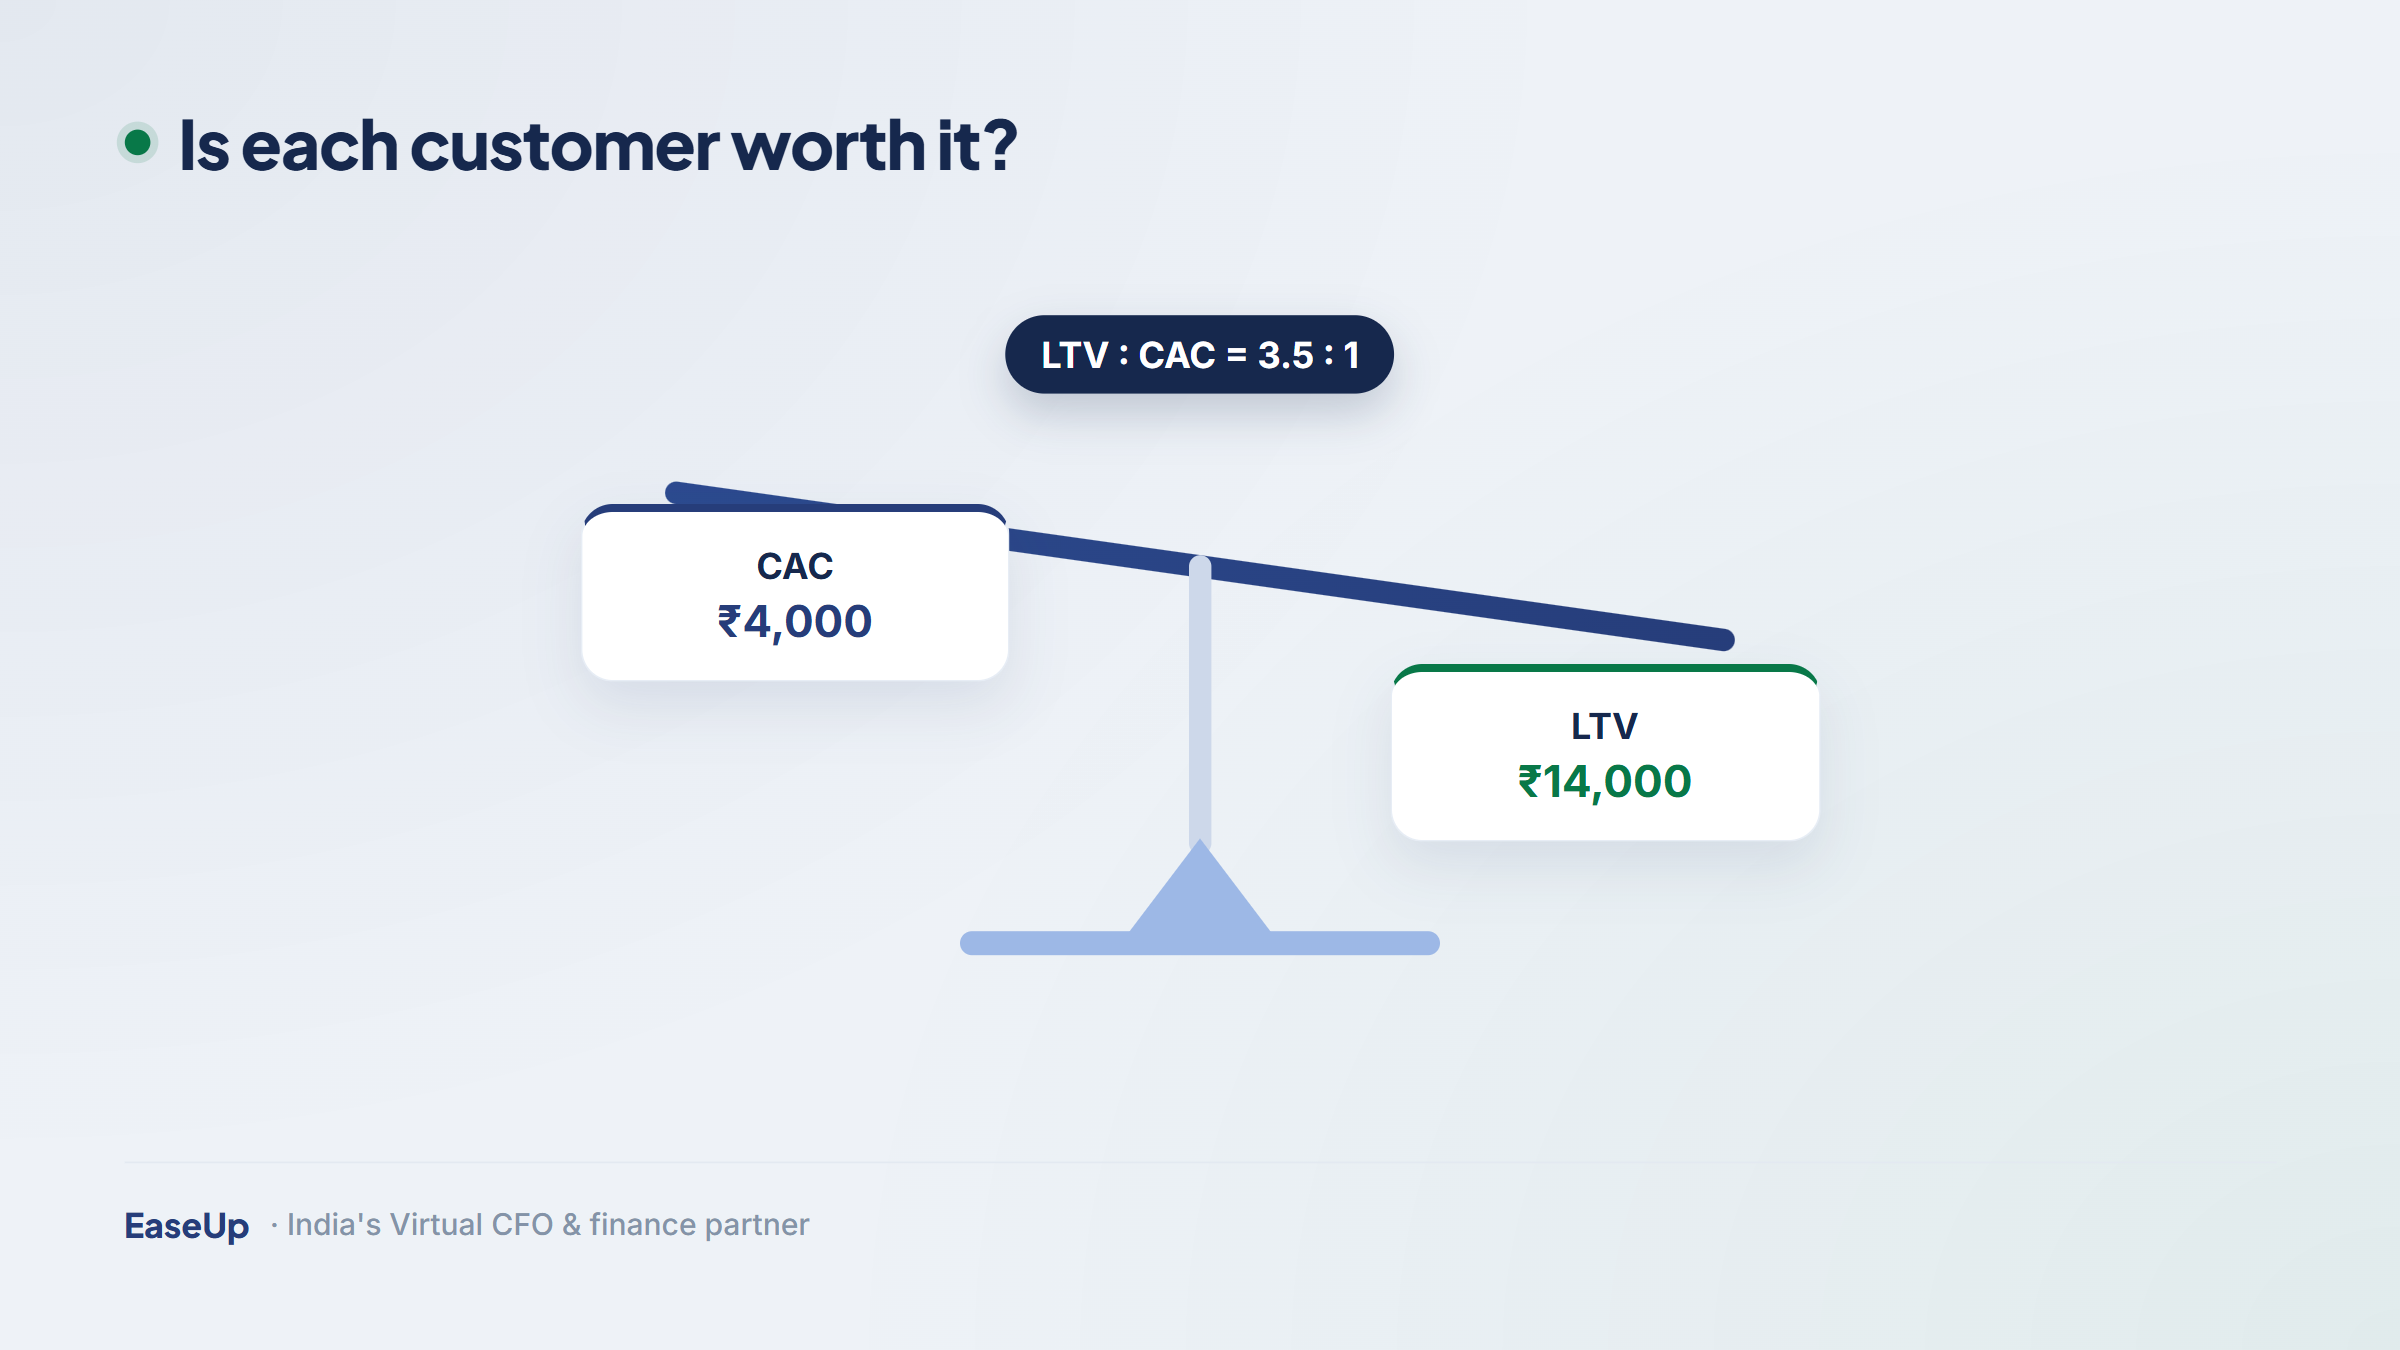
Growth feels great until you do the maths and realise you are paying Rs 3 to earn Rs 1. That is the trap unit economics is built to expose. It strips your whole business down to a single customer and asks the only question that decides whether you live or die: do you make more from that customer than it costs to win and keep them?
Most guides on this topic are written for US dollars, US churn, and US deal sizes. This one is built for India. Plain English, copyable rupee (Rs) examples, FY 2025-26 benchmarks, and the founder-plus-SME view. By the end you will know every metric that matters and exactly how to calculate yours.
Unit economics measure the profit (or loss) of a single "unit" of your business. For most startups and small firms, the unit is one customer. You take everything that customer brings in over their lifetime, subtract what it cost to acquire and serve them, and see what is left.
Why bother with one customer when you run a whole company? Because if one customer loses you money, a thousand customers lose you a thousand times more. Scaling a broken unit just burns cash faster. Healthy unit economics mean growth makes you stronger, not poorer.
 Note: Unit economics are not the same as profit and loss. Your overall P&L can look bad while you are still young, but if the maths on a single customer is healthy, growth will eventually carry you to profit. That is what investors look for.
CAC = Total sales and marketing spend ÷ Number of new customers acquired.
Customer Acquisition Cost is the full price of turning a stranger into a paying customer. The word that trips founders up is full. CAC is not just your ad spend. It includes salaries of the sales and marketing team, tools, agency fees, content, events, and commissions.
Example: in one quarter you spend Rs 12,00,000 on ads, Rs 9,00,000 on the sales-and-marketing team, and Rs 3,00,000 on tools and agencies. That is Rs 24,00,000 total. You won 80 new customers. Your CAC is Rs 24,00,000 ÷ 80 = Rs 30,000 per customer.
 Watch out: The most common CAC mistake is under-counting costs. Founders include ad spend but forget salaries, software, and agency fees. That makes CAC look tiny and your unit economics look healthier than they are. Count every rupee that helped win the customer.
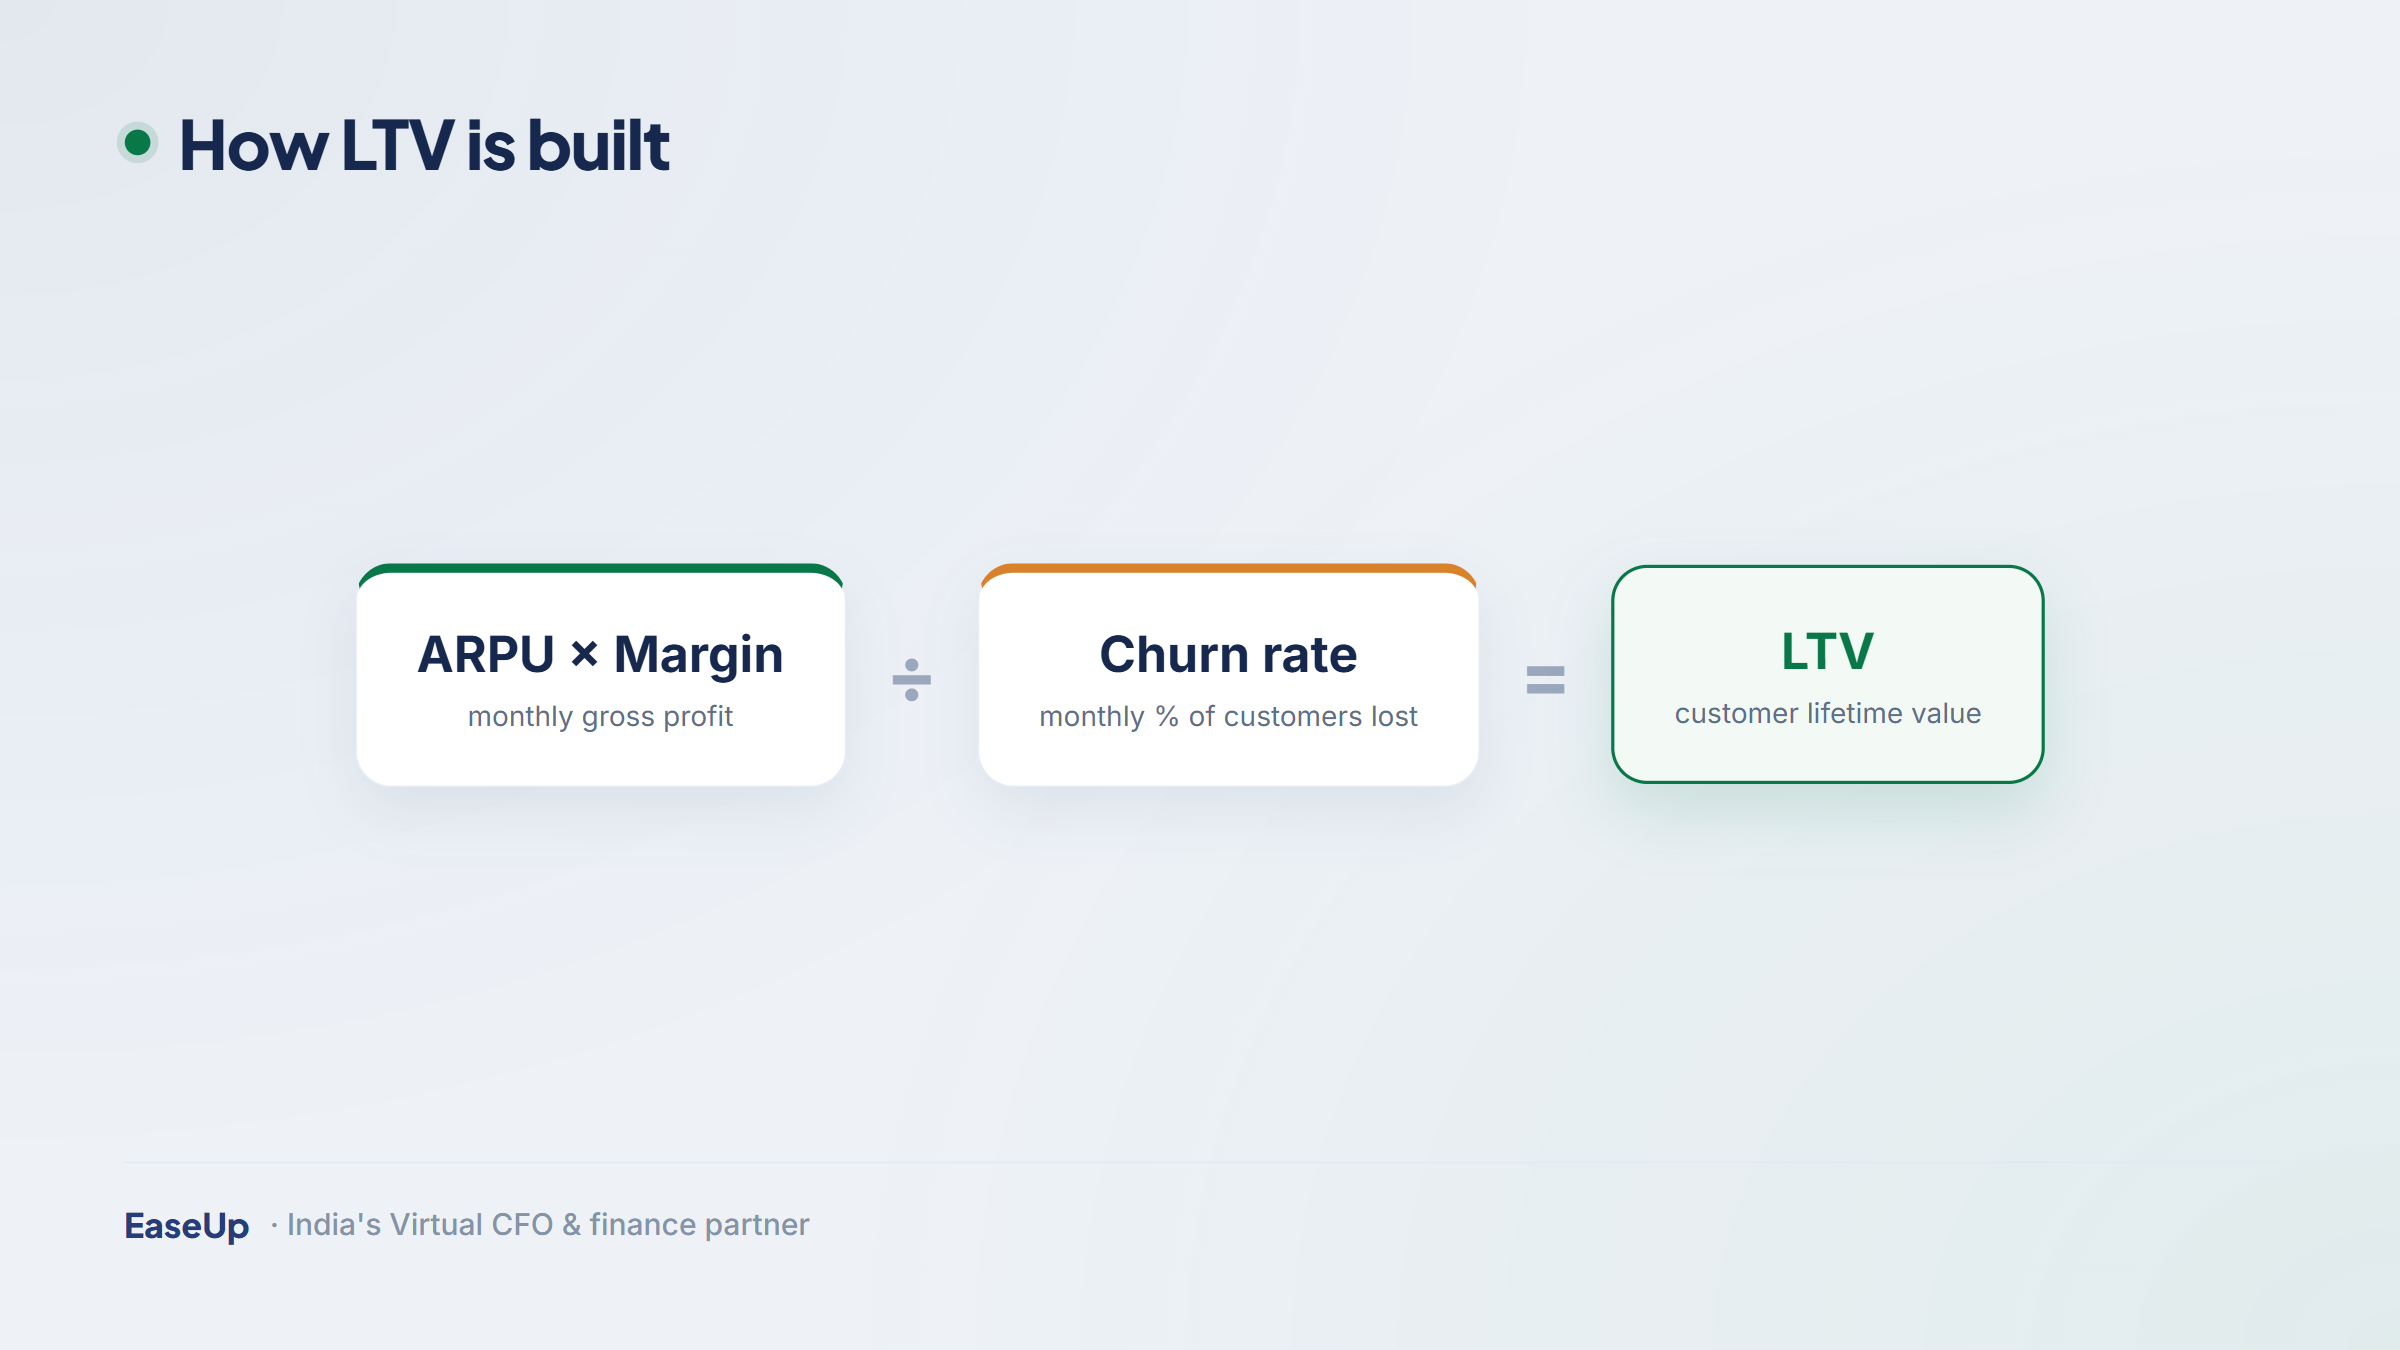
Lifetime Value (LTV) is the total gross profit a customer brings you across their entire relationship with your business. The clean, margin-aware formula is:
LTV = (Yearly revenue per customer × Gross margin %) ÷ Annual churn rate.
Three inputs drive it: how much a customer pays you, how much of that is actual profit (gross margin), and how long they stay (the inverse of churn). Raise any one of these and LTV climbs.
Example: a customer pays you Rs 1,00,000 a year. Your gross margin is 70%. Your annual churn is 20% (so customers stay about 5 years). LTV = (Rs 1,00,000 × 0.70) ÷ 0.20 = Rs 3,50,000. That single customer is worth Rs 3.5 lakh in gross profit over their life.
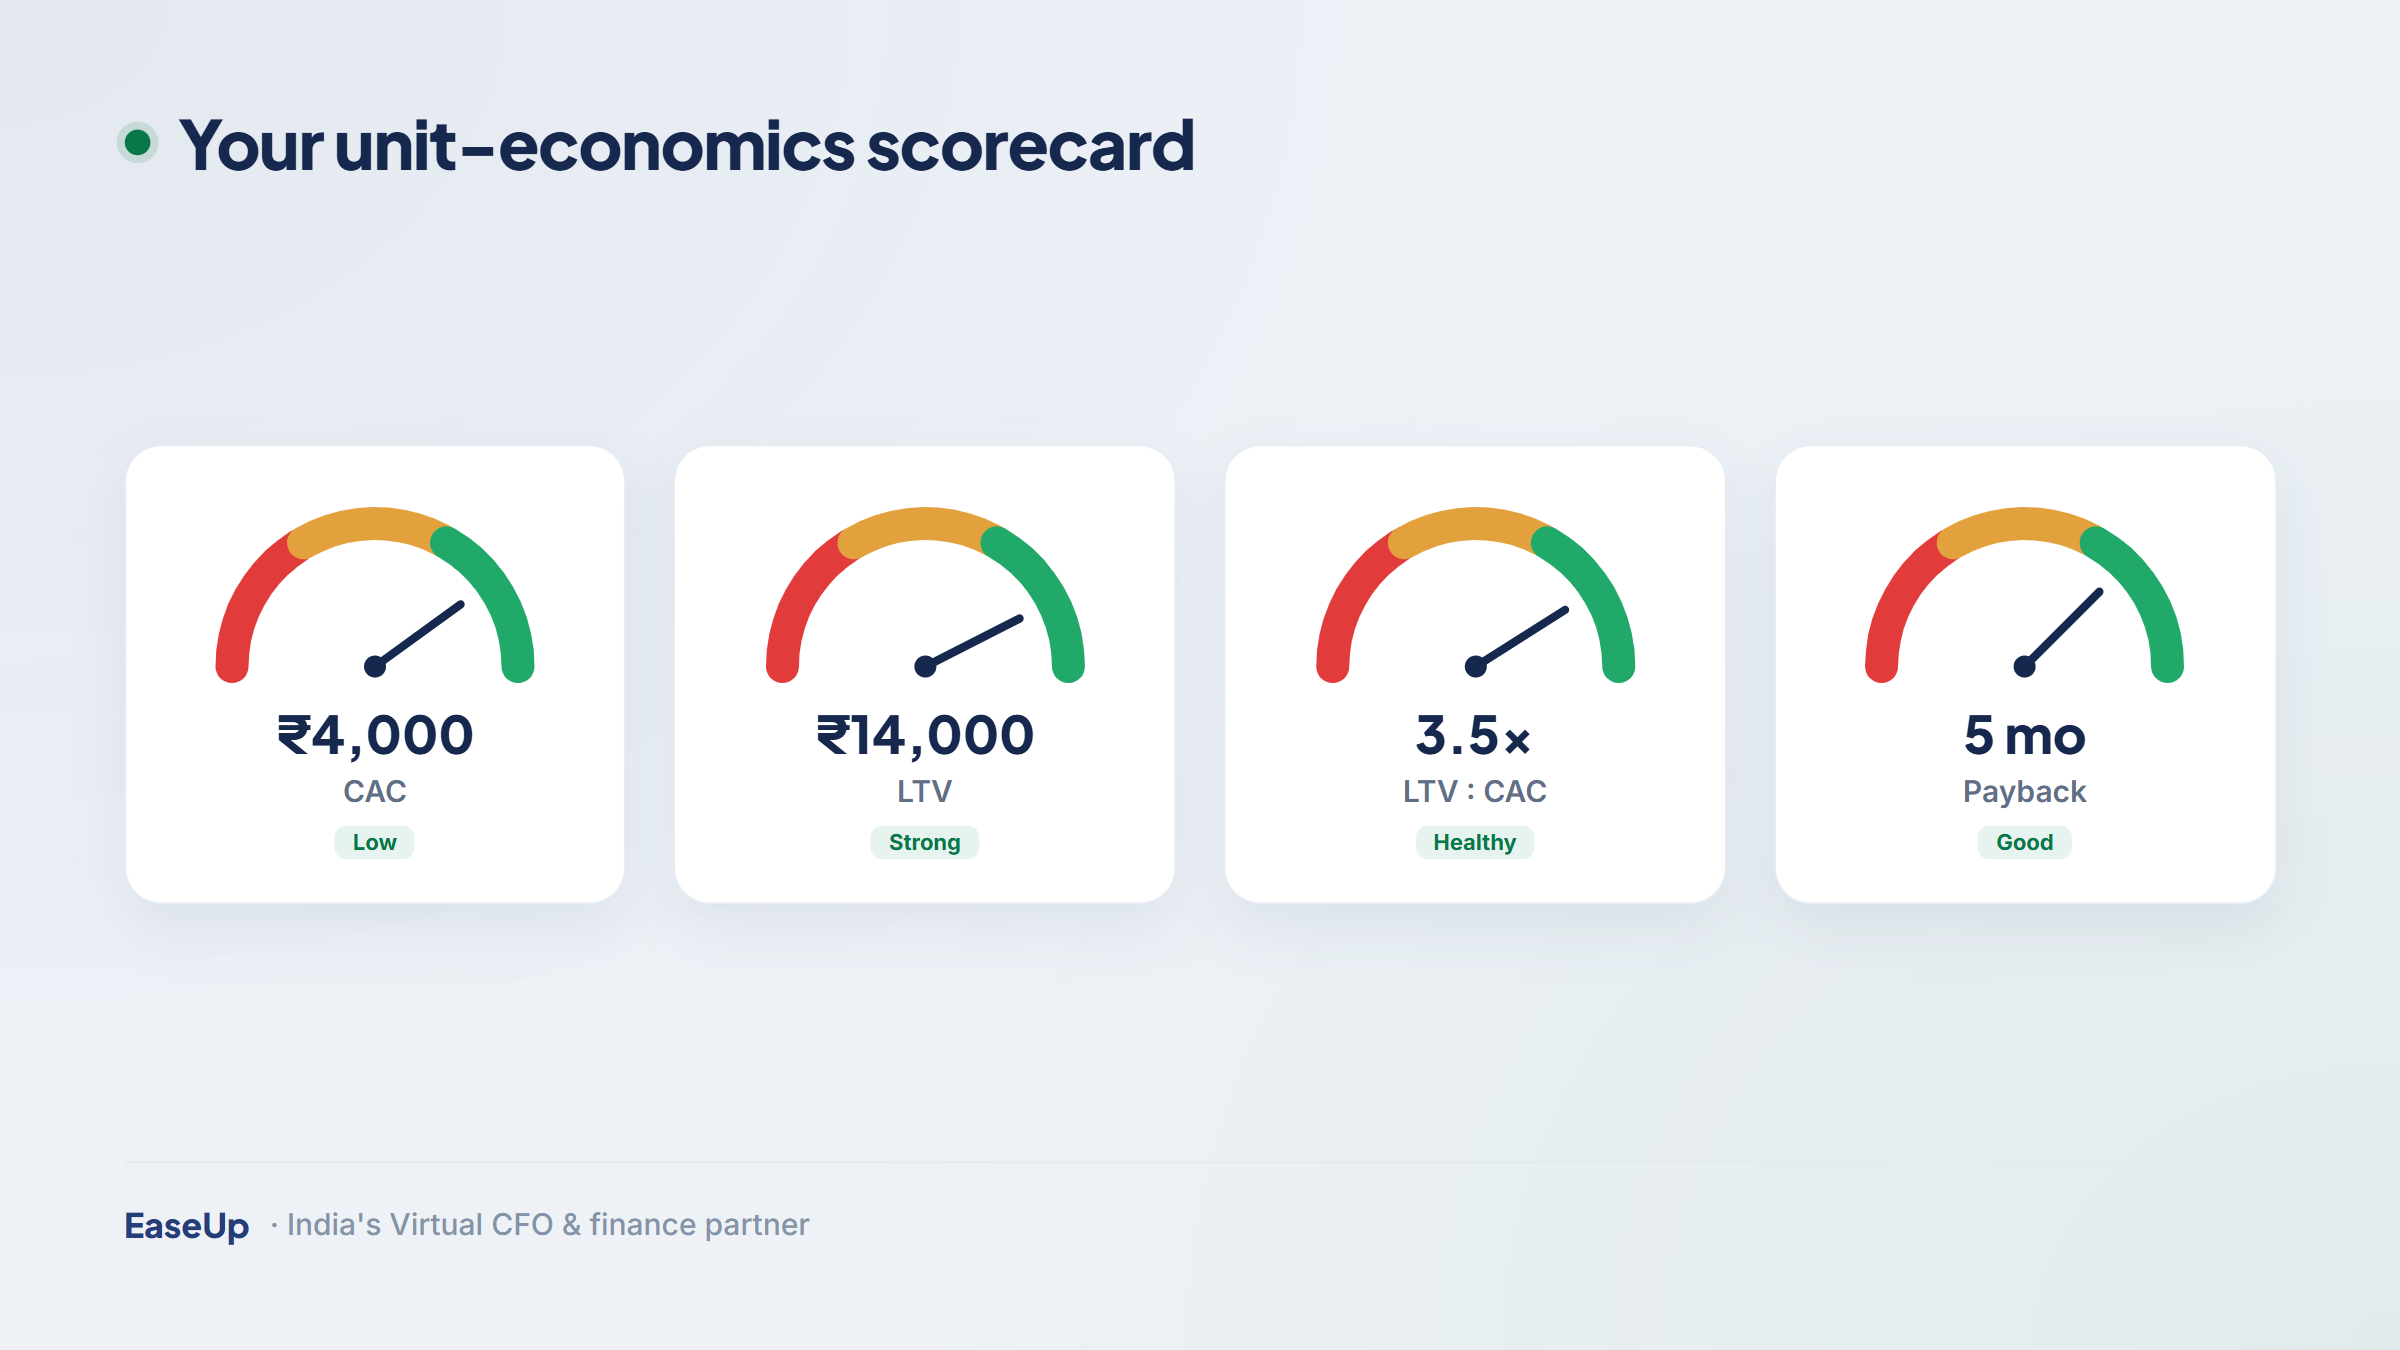
On its own, CAC or LTV tells you little. Put them together and you get the single most important unit-economics number: the LTV to CAC ratio.
LTV:CAC = Lifetime Value ÷ Customer Acquisition Cost.
Using our two examples: LTV of Rs 3,50,000 ÷ CAC of Rs 30,000 = a ratio of about 11.7:1. For every Rs 1 spent winning a customer, you earn back Rs 11.7 in gross profit. That is excellent. Here is how to read any ratio:
LTV:CAC ratio | What it means | What to do |
Below 1:1 | You lose money on every customer | Stop scaling. Fix the model first. |
1:1 to 3:1 | You make money but slowly | Improve before pouring in cash |
3:1 | The healthy sweet spot | Scale with confidence |
Above 5:1 | Very efficient, maybe under-investing | Consider spending more to grow faster |
:check_mark_button: Founder tip: A sky-high ratio is not always a win. A ratio of 8:1 or more can mean you are under-spending on growth and leaving market share on the table. A good virtual CFO helps you find the line between efficient and timid.
Ratios ignore time. A 4:1 ratio is great, but if it takes three years to earn that money back, your cash runs out first. That is why the CAC payback period matters just as much.
CAC payback (months) = CAC ÷ (Monthly revenue per customer × Gross margin %).
Example: CAC is Rs 30,000. The customer pays Rs 8,333 a month (Rs 1,00,000 a year) at 70% gross margin, so they give you Rs 5,833 of gross profit each month. Payback = Rs 30,000 ÷ Rs 5,833 = about 5.1 months. You recover your acquisition cost in roughly five months, then it is profit.
Note: Under 12 months payback is healthy for most Indian SaaS and subscription businesses. Under 6 months is excellent. Anything beyond 18 months means your cash is locked up too long, which strains your runway even if the LTV:CAC ratio looks fine.
CAC, LTV, the ratio, and payback sit on top of four smaller numbers. Get these right and everything above them is accurate.
Churn rate. The percentage of customers (or revenue) you lose in a period. If 5 of 100 customers leave each month, monthly churn is 5%. Lower churn means longer customer life and higher LTV.
ARPU. Average Revenue Per User — total revenue ÷ number of customers. It tells you how much a typical customer pays, and is the starting point for LTV.
Gross margin. (Revenue minus cost of goods sold) ÷ revenue. For SaaS this is hosting, support, and payment fees. A 70% gross margin means Rs 70 of every Rs 100 is real profit before sales and overheads.
Contribution margin. Revenue per customer minus the variable cost to serve them. It is the cash each customer actually contributes toward covering your fixed costs and CAC.
If these inputs are guesses, every metric above is a guess too. Clean bookkeeping is what turns these numbers from a gut feeling into a fact.
Let us pull it all together with one realistic FY 2025-26 example. Meet a B2B SaaS startup based in Bengaluru, selling to mid-market Indian companies.
Metric | Value | How we got it |
Quarterly sales + marketing spend | Rs 24,00,000 | Ads + team + tools + agency |
New customers in the quarter | 80 | From CRM |
CAC | Rs 30,000 | Rs 24,00,000 ÷ 80 |
Yearly revenue per customer | Rs 1,00,000 | ARPU × 12 |
Gross margin | 70% | After hosting + support |
Annual churn | 20% | ~5-year customer life |
LTV | Rs 3,50,000 | (1,00,000 × 0.70) ÷ 0.20 |
LTV:CAC ratio | 11.7:1 | Rs 3,50,000 ÷ Rs 30,000 |
CAC payback | ~5.1 months | 30,000 ÷ (8,333 × 0.70) |
The verdict: strong unit economics. The ratio is well above 3:1 and payback is under 6 months. This founder can scale spend with confidence. If the ratio were 11:1 because they were barely spending, the smarter move would be to invest more and grow faster.
Unit economics are not only a venture-funded startup idea. A bootstrapped services firm — say a Pune-based digital agency — needs the same discipline, because it has no investor to rescue a bad month.
Metric | Value | Note |
Cost to land one client | Rs 50,000 | Sales effort + proposals + referral fees |
Average revenue per client / year | Rs 6,00,000 | Retainer-based |
Gross margin | 40% | Services are people-heavy |
Average client life | 2 years | Churn ~50% per year |
LTV | Rs 4,80,000 | (6,00,000 × 0.40) × 2 |
LTV:CAC ratio | 9.6:1 | Rs 4,80,000 ÷ Rs 50,000 |
Even with a thinner 40% margin, the agency has healthy economics because clients stay and pay well. The lesson: a lower margin can still work if LTV is strong. Solid financial planning and forecasting helps SMEs spot when a "growing" client is actually unprofitable.
Here is what global guides miss. Indian deal sizes (ACVs) are often 40-60% lower than US ones, while sales cycles stay just as long. So a US benchmark applied to an Indian startup can paint a falsely gloomy or rosy picture. Use India-grounded numbers instead.
Stage (Indian B2B SaaS) | Typical CAC | LTV:CAC | CAC payback |
Early (Rs 10-30 Cr ARR) | Rs 1.2L - Rs 2.5L | 2.5x - 3x | 14-20 months |
Scaling (Rs 60-100 Cr ARR) | Rs 2L - Rs 5L | 3x - 5x | 10-14 months |
Notice that early-stage Indian SaaS often runs below the famous 3:1 ratio, and that is normal. Efficiency usually improves as you scale and retention compounds. Judge yourself against Indian peers, not Silicon Valley headlines. For a sense of the wider ecosystem and recognised investors, the government Startup India portal is a useful reference.
Global unit-economics templates ignore India-specific costs. These quietly change your real numbers:
GST on acquisition costs. You pay Goods and Services Tax on ad platforms, agencies, and tools. You may claim Input Tax Credit, but timing and reconciliation via your GSTR-2B affect cash. Check the official portal at gst.gov.in.
TDS on vendor payments. Tax Deducted at Source applies to agency and contractor invoices and must be deposited on time. See incometax.gov.in for the rules.
Gross margin must be after these. Payment-gateway fees, GST you cannot recover, and support costs all eat into the gross margin that drives LTV. Build them in or your LTV is overstated.
Watch out: A revenue figure with GST still in it is not your revenue. GST you collect belongs to the government. Always strip it out before calculating ARPU, gross margin, and LTV, or every unit-economics number will be inflated.
If your LTV:CAC ratio is below 3:1 or payback is too long, you have three levers. Pull them in this order.
Lever | What to do | Effect |
Lower CAC | Double down on channels that convert; cut wasteful spend; lean on referrals | Direct boost to the ratio |
Raise LTV via retention | Reduce churn with onboarding, support, and product value | Compounds LTV powerfully |
Raise LTV via pricing | Test price increases; add upsells and annual plans | Lifts ARPU and margin |
Lift gross margin | Cut serving costs; automate support; renegotiate hosting | Improves both LTV and payback |
Of these, reducing churn is usually the highest-leverage move, because a longer customer life multiplies through the LTV formula. A virtual CFO can model each lever and tell you which one moves your ratio the most for the least effort.
Most founders are brilliant at product and shaky on the numbers behind growth — and that is completely normal. At EaseUp, our virtual CFO services turn unit economics from a scary spreadsheet into a clear, monthly dashboard you actually trust.
We build your CAC, LTV, ratio, and payback from clean books, layer in India-specific GST and TDS reality, and flag when a channel or customer segment is quietly losing money. You focus on growth; we keep the maths honest. The Institute of Chartered Accountants of India sets the professional standards our work follows.
Unit economics measure the profit or loss of a single customer. You compare what a customer is worth over their lifetime (LTV) against what it costs to acquire and serve them (CAC). If a single customer is profitable, scaling makes the business stronger. If not, growth just burns cash faster. It is the clearest test of whether a business model actually works.
CAC = total sales and marketing spend ÷ number of new customers acquired in that period (include salaries, tools, and agency fees, not just ads). LTV = (yearly revenue per customer × gross margin %) ÷ annual churn rate. For example, a customer paying Rs 1,00,000 a year at 70% margin with 20% churn has an LTV of Rs 3,50,000.
A ratio of 3:1 or higher is the healthy benchmark globally and in India: for every Rs 1 spent acquiring a customer, you earn back Rs 3 in gross profit. Below 1:1 you lose money on every customer. That said, early-stage Indian B2B SaaS often runs at 2.5x to 3x because deal sizes are lower than in the US, and improves to 3x-5x as the company scales and retention compounds.
CAC payback is the number of months it takes to earn back what you spent acquiring a customer. The formula is CAC ÷ (monthly revenue per customer × gross margin %). For most Indian SaaS and subscription businesses, under 12 months is healthy and under 6 months is excellent. Beyond 18 months ties up cash too long and strains your runway, even if the LTV:CAC ratio looks fine.
GST and TDS change both sides of the equation. You pay GST on ads, tools, and agencies (claimable as Input Tax Credit, subject to reconciliation timing), and TDS applies to vendor and contractor invoices. On the revenue side, GST you collect belongs to the government and must be stripped out before calculating ARPU, gross margin, and LTV. Ignore these and your unit economics will look better on paper than they are in cash.
This article is for general information only and is not financial, tax, or legal advice. Tax rules, benchmarks, and compliance timelines change; please consult a qualified professional or EaseUp before making decisions for your business.


Your trusted partner for all your Financial needs.


Finance Management
Strategic Services