
If you are preparing to raise capital, these are the metrics investors will use to decide whether your startup looks fundable. The formulas matter, but the bigger question is whether your reporting is clean enough to hold up under investor scrutiny.
This guide shows what each metric means, what good usually looks like, and where founders often need tighter reporting before investor conversations become serious.
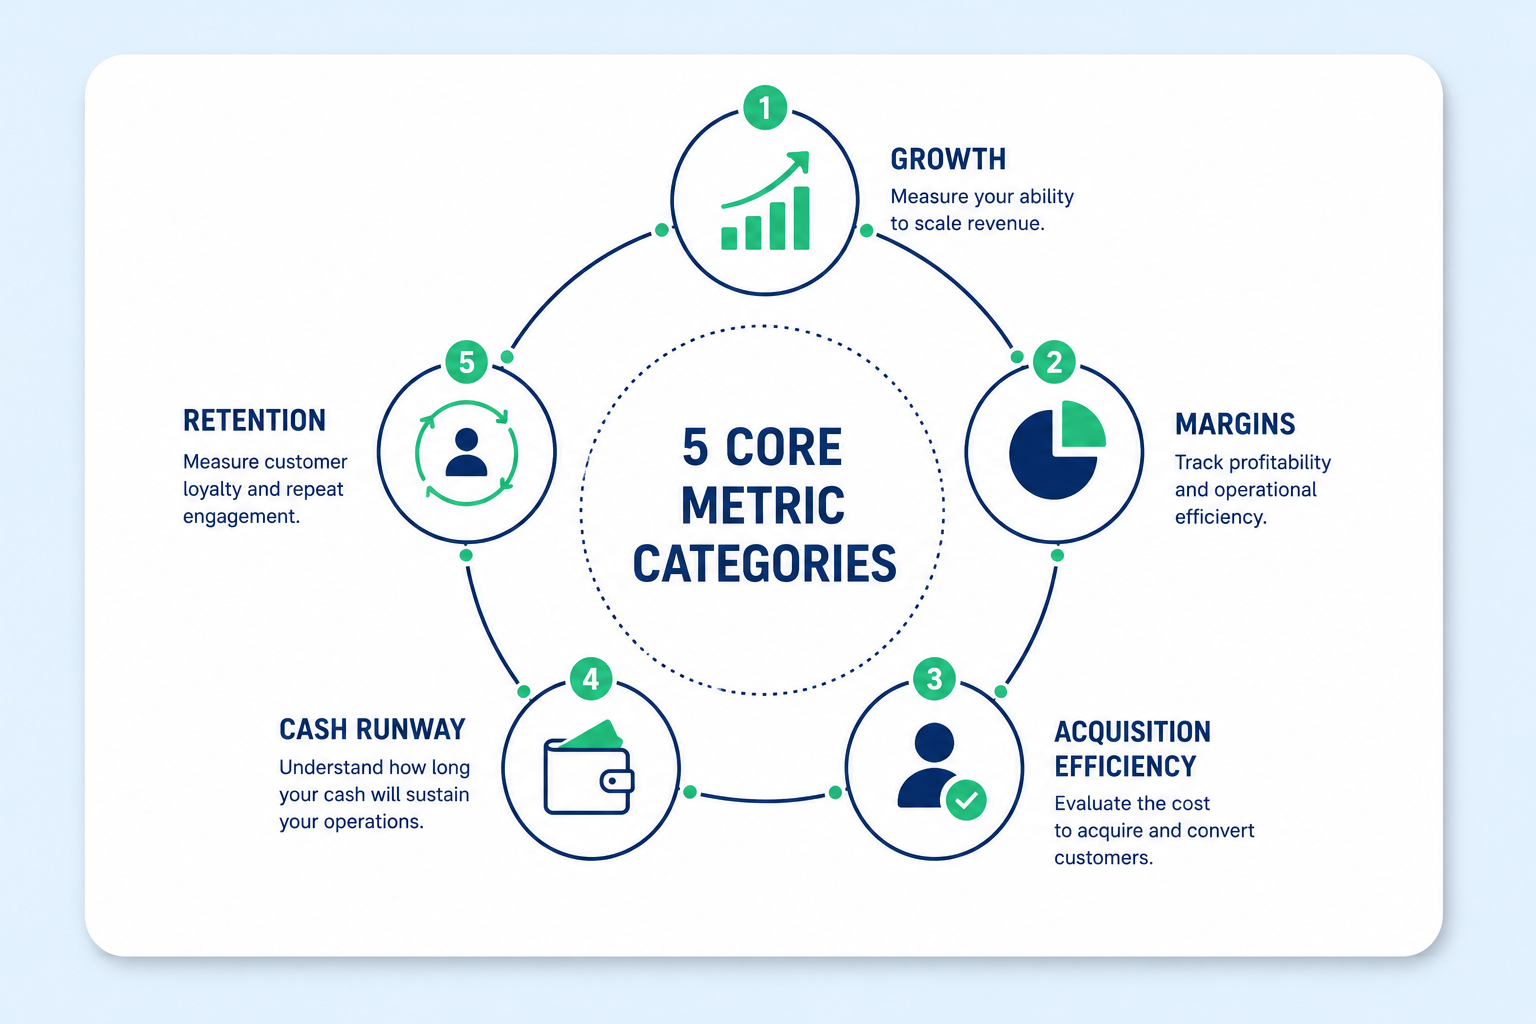
Revenue growth: Is the company building real momentum?
Gross margin: Is the business structurally attractive?
CAC and LTV: Can growth become economically durable?
Burn and runway: How much time is left to hit the next milestone?
Retention and NRR: Do customers stay and expand?
If your reporting still feels stitched together manually, tightening your bookkeeping, strengthening accounting and compliance, and standardizing monthly reporting through monthly accounting usually improves these conversations quickly.
Investor expectations shift dynamically as your startup matures from seed to growth stage:
Stage | What Investors Focus On | What Founders Must Show |
Seed | Momentum, early retention, believable market pull, enough runway to learn | Growth trend, early customer proof, disciplined cash view, a realistic model |
Series A | Repeatability, stronger unit economics, clearer retention and scaling discipline | Consistent growth, cleaner CAC and payback, sharper NRR, better reporting maturity |
Growth Stage | Efficiency, expansion quality, margin durability, governance discipline | Reliable forecasting, stronger cash efficiency, high-quality revenue, lower surprises |
If you already know the story you need to tell investors, the next step is not learning more formulas. It is tightening historical reporting, pressure-testing assumptions, and building a model you can defend live in the room.
What it is: Your normalized annual recurring revenue from subscriptions and repeat contracts.
Formula: MRR × 12
Why investors care: ARR is one of the clearest signals of scale in recurring-revenue businesses. It shows the size of the revenue base investors are underwriting.
Benchmarks:
Seed stage: roughly $100K-$1M ARR
Series A: roughly $1M-$5M ARR
Series B: roughly $5M-$15M ARR
Red flag: Including one-time implementation fees, services revenue, or irregular contracts inside ARR. Investors usually test this quickly in due diligence.
What investors ask next: How much of this ARR is new versus expansion? How concentrated is it across a small set of customers?
What it is: Your monthly recurring revenue from active subscriptions or ongoing contracts.
Formula: Sum of all monthly recurring revenue
Why investors care: MRR shows your baseline revenue engine and helps investors evaluate momentum, predictability, and short-term trend quality.
Break it down further:
New MRR: Revenue from newly acquired customers.
Expansion MRR: Added revenue from existing customers.
Churned MRR: Revenue lost from cancellations.
Net New MRR: New plus expansion minus churn.
Red flag: Reporting only total MRR without explaining what is being added and what is leaking out.
What it is: The month-on-month percentage growth in MRR.
Formula: (Current Month MRR - Previous Month MRR) / Previous Month MRR × 100
Benchmarks:
Good: 10-15% month-on-month
Great: 15-20% month-on-month
Exceptional: 20%+ month-on-month
Context matters: Early-stage companies can grow faster on a percentage basis. A smaller company growing 20% month-on-month is not comparable to a much larger one doing the same.
What good looks like: A visible trend over 6 to 12 months, not one lucky spike caused by a single deal or discounting push.
What it is: Revenue minus direct delivery costs, expressed as a percentage.
Formula: (Revenue - Cost of Goods Sold) / Revenue × 100
What usually counts as direct cost:
Hosting and cloud infrastructure
Third-party software tied to delivery
Payment processing fees
Some delivery or customer support costs, depending on the model
Benchmarks by business type:
SaaS: 70-85%
Marketplace: 50-70%
E-commerce: 30-50%
Hardware: 20-40%
Why investors care: Growth looks very different when a business keeps most of its revenue versus when each additional sale carries heavy delivery friction.
What investors ask next: Is margin stable? Improving? What is dragging it down today?
What it is: The total cost required to acquire a new customer.
Formula: (Sales + Marketing Expenses) / Number of New Customers Acquired
Important nuance: Use fully loaded CAC where possible. That means including salaries, tools, ad spend, events, and channel costs connected to acquisition.
Why investors care: CAC tells them how expensive growth is becoming and whether additional capital can be deployed efficiently.
Red flag: Understating CAC by excluding founder-led sales effort, channel costs, or long sales-cycle overhead.
Founder tip: Channel-level CAC is usually more useful than a blended number because it shows where scale is actually working.
What it is: The value you expect to earn from a customer over the relationship.
Simple formula: Average Revenue Per User × Customer Lifetime
More practical formula: ARPU × Gross Margin % / Monthly Churn Rate
Example: ARPU: $500/month, Gross Margin: 80%, Monthly Churn: 2%. LTV = $500 × 0.80 / 0.02 = $20,000.
Why investors care: LTV helps them judge whether acquisition spending creates durable value or only expensive top-line growth.
Red flag: Projecting an unrealistic customer lifetime before retention is observable.
What it is: The amount of customer value created relative to the cost of acquiring that customer.
Formula: LTV / CAC
Benchmarks:
Below 1:1: The business loses money on acquisition.
1:1 to 2:1: Weak and risky.
3:1: Commonly viewed as healthy.
5:1+: Strong, but sometimes a sign you may be underinvesting in marketing.
What investors look for: Not just the ratio today, but whether it is improving and whether the assumptions behind it are honest.
What it is: How many months it takes to earn back your acquisition cost.
Formula: CAC / (ARPU × Gross Margin %)
Example: CAC: $6,000, ARPU: $500/month, Gross Margin: 80%. Payback = $6,000 / ($500 × 0.80) = 15 months.
Benchmarks:
Excellent: Under 12 months
Good: 12-18 months
Acceptable: 18-24 months
Concerning: 24+ months
Why investors care: Shorter payback means capital recycles faster and growth requires less financing pressure.
What it is: The percentage of customers who cancel during a period.
Formula: Customers Lost During Period / Customers at Start of Period × 100
Benchmarks (monthly):
SMB-focused: 3-5%
Mid-market: 1-2%
Enterprise: Under 1%
Why investors care: Logo churn is a direct signal of product stickiness. If customers leave quickly, growth quality becomes harder to defend.
Red flag: Reporting a blended churn number without segmenting customer types or cohorts.
What it is: The percentage of recurring revenue lost through cancellations and downgrades.
Formula: MRR Lost During Period / MRR at Start of Period × 100
Why investors care: Revenue churn often matters more than logo churn because not all customers contribute equally.
What investors ask next: Are you losing small accounts while retaining large ones, or is value leaking from your best customers too?
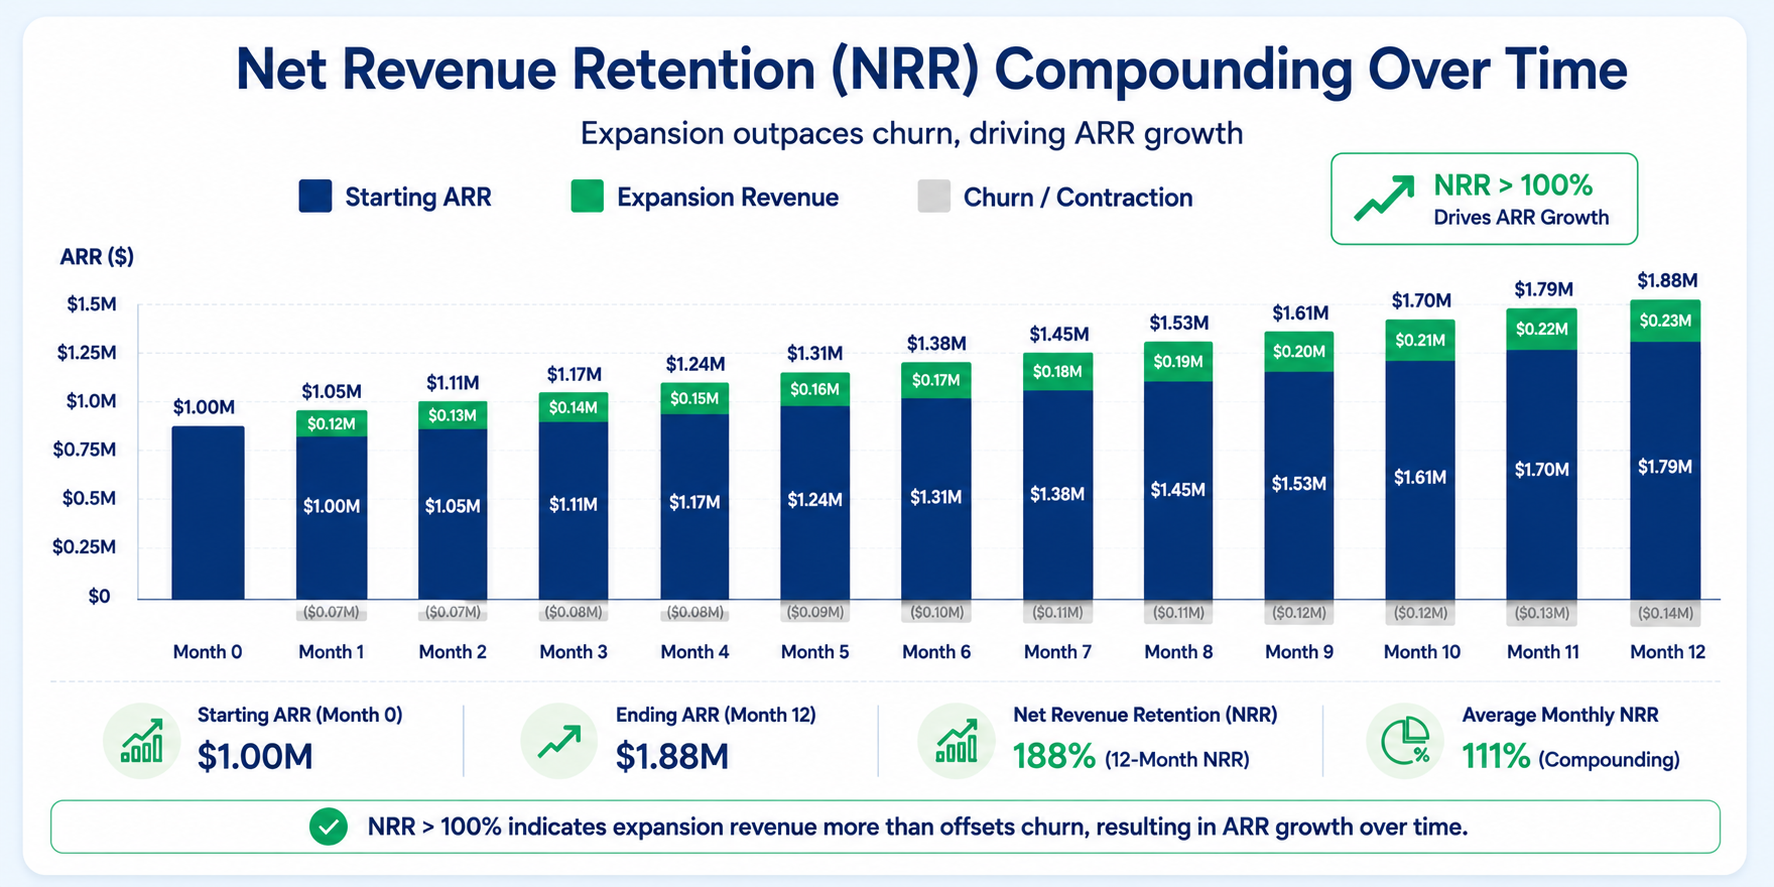
What it is: The percentage of revenue retained from existing customers after expansion, churn, and contraction.
Formula: (Starting MRR + Expansion - Churn - Contraction) / Starting MRR × 100
Example: Starting MRR: $100,000, Expansion: $15,000, Churned MRR: $8,000, Contraction: $2,000. NRR = ($100,000 + $15,000 - $8,000 - $2,000) / $100,000 = 105%.
Benchmarks:
Below 100%: The base is shrinking without new sales.
100-110%: Solid for many SMB-focused businesses.
110-130%: Excellent.
130%+: Exceptional.
Why investors love it: NRR above 100% means the existing customer base is compounding, which makes growth more durable.
What it is: How much cash the business consumes in a given month.
Formula: Beginning Cash Balance - Ending Cash Balance over a month
Two types:
Gross Burn: Total monthly expenses.
Net Burn: Expenses minus revenue.
Why investors care: Net burn shows how quickly a company is consuming capital while trying to reach the next milestone.
Red flag: Founders who can quote revenue but not cash consumption.
What it is: How many months you can operate before cash runs out.
Formula: Current Cash Balance / Monthly Net Burn
Example: Cash: $2,000,000, Monthly Net Burn: $150,000. Runway = $2,000,000 / $150,000 = 13.3 months.
Best practice: Founders usually look stronger when they begin fundraising with enough runway (typically 6+ months) to run a real process rather than when time pressure is already visible.
What investors ask next: What milestone does this runway get you to? If growth slips, what changes?
What it is: How much cash you burn relative to net new ARR created.
Formula: Net Burn / Net New ARR
Example: Net Burn: $500,000 per quarter, Net New ARR: $300,000 per quarter. Burn Multiple = $500,000 / $300,000 = 1.67x.
Benchmarks:
Under 1x: Highly efficient
1-1.5x: Excellent
1.5-2x: Good
2-3x: Acceptable
3x+: Concerning
Why investors care: This is one of the clearest measures of whether cash is turning into growth efficiently.
What it is: A sales efficiency metric showing how much ARR growth you generate per dollar of prior sales and marketing spend.
Formula: (Current Quarter ARR - Previous Quarter ARR) / Previous Quarter Sales and Marketing Spend
Example: ARR Growth: $200,000, Previous Quarter Sales and Marketing Spend: $250,000. Magic Number = $200,000 / $250,000 = 0.8.
Benchmarks:
Below 0.5: Inefficient
0.5-0.75: Needs work
0.75-1.0: Good
Above 1.0: Strong
Why investors care: The Magic Number helps them judge whether scaling go-to-market investment is likely to pay off.
Metrics alone rarely close the conversation. Investors usually ask what is behind the number and whether it is improving for the right reasons.
If growth is high: Is it durable or discount-driven?
If CAC is rising: Are channel economics changing or are you moving upmarket?
If churn is high: Where exactly is the leak? Onboarding, pricing, product fit, or customer quality?
If margins are weak: Is that temporary or structural?
If burn is high: What milestone justifies it?
A strong founder does not just memorize the metric. A strong founder can explain what is driving it, what is changing, and what the next six to twelve months should look like.
Instead of scattering numbers across different files, create one investor-ready metrics pack that includes:
Current month actuals
Last 12 months of trend lines
Cohort analysis for churn and retention
CAC by major acquisition channel
Cash balance, net burn, and runway view
Short notes explaining major jumps, dips, or anomalies
Many founders use a Virtual CFO to structure that reporting layer before investor meetings become active.
In meetings, you should be able to answer without hesitation:
ARR and MRR today
Growth rate last month and last quarter
Churn and NRR
CAC, LTV:CAC, and payback period
Burn rate and runway
Fumbling on basic metrics creates doubt about operating discipline even when the product story is strong.
Leading with vanity metrics: Total users or signups without quality, retention, or revenue context.
Changing formulas over time: Making trend comparisons unreliable.
Ignoring cohort analysis: Blended churn often hides the real story.
Using one blended LTV for very different customer groups: SMB and enterprise economics can differ dramatically.
Confusing revenue with cash: One does not automatically equal the other.
Including one-time revenue in recurring metrics: Investors usually catch this quickly in diligence.
Presenting metrics without a fundraising use-of-funds story: Numbers must connect to what capital unlocks next.
Most founders can calculate these metrics. The harder part is making them consistent, board-ready, and defensible in diligence. Once investors start asking about cohort retention, revenue quality, cash efficiency, and forecast logic, gaps in bookkeeping, reporting structure, and financial modelling become much more expensive.
Cleaning up historical reporting through bookkeeping
Tightening compliance discipline through accounting and compliance
Building valuation logic through business valuation
Preparing investor materials through fundraise preparations
Getting diligence-ready through due diligence support
Standardizing monthly investor reporting through monthly accounting
For founders who want a practical baseline before fundraising begins, our accounting guide for startups is a useful starting point.
Financial metrics are not just fundraising vocabulary. They are the evidence investors use to judge whether your growth is durable, your cash is being used well, and your company is ready for a larger round.
If your metrics pack is still being assembled from spreadsheets right before investor meetings, the risk is not just weak reporting. It is lost credibility. EaseUp helps founders clean up reporting, tighten unit economics, and walk into fundraising conversations with numbers they can defend.
At seed, investors usually focus more on product-market fit signals, growth momentum, early retention, and whether the company has enough runway to keep learning. By Series A, they expect stronger unit economics, cleaner retention, better reporting, and more credible efficiency metrics such as CAC payback, NRR, and burn multiple.
Not necessarily. Early-stage businesses often improve unit economics over time. What matters more is whether you understand why the ratio is weak, whether it is trending in the right direction, and whether your plan to improve acquisition efficiency or retention is believable.
Focus first on cash, runway, hiring pace, and leading indicators such as activation, engagement, waitlist quality, conversion tests, or letters of intent. Investors still expect a disciplined financial model even before full revenue history exists.
A useful dashboard usually includes current ARR or MRR, 12-month trend lines, gross margin, CAC, LTV, payback period, churn, NRR, burn rate, runway, and a short explanation of unusual changes. The goal is not just to show numbers, but to make the business legible quickly.
One of the most common mistakes is presenting numbers without explaining the assumptions behind them. The second is using blended metrics that hide differences between customer segments, channels, or cohorts.


Your trusted partner for all your Financial needs.


Finance Management
Strategic Services