
TL;DR — the 30-second version
• Track these 15 SaaS financial metrics in three buckets: revenue, unit economics, and cash. Skip the vanity numbers.
• The core five: MRR, ARR, Net Revenue Retention (NRR), Customer Acquisition Cost (CAC), and runway. If you watch nothing else, watch these.
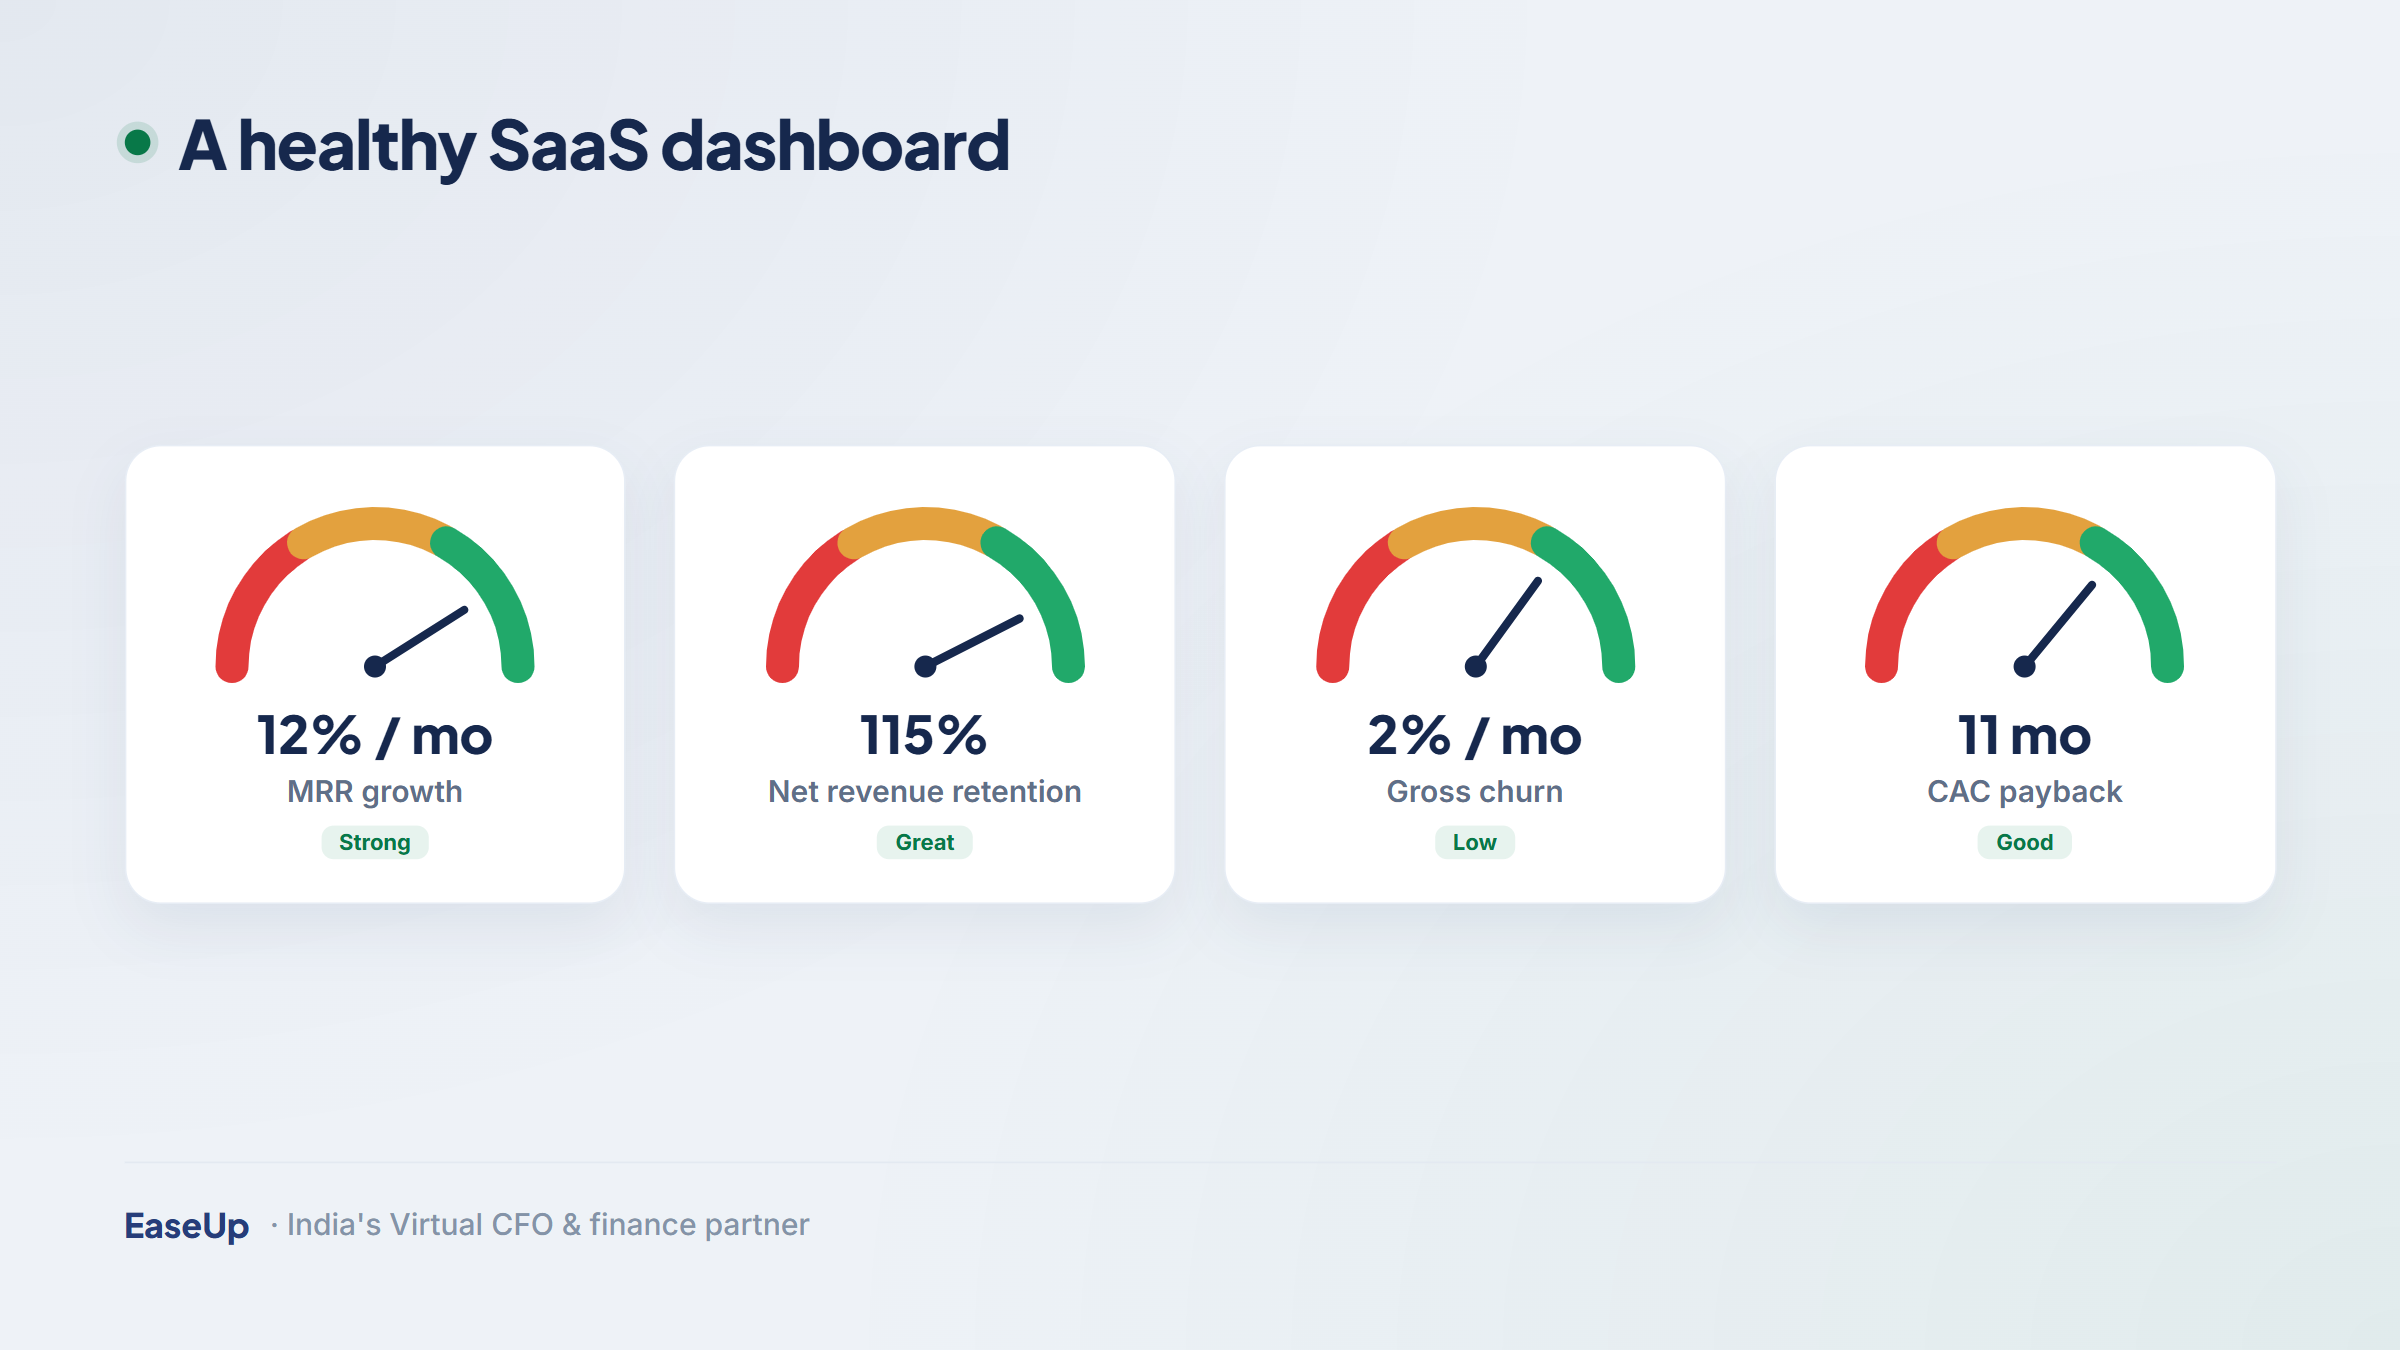
• Good 2026 targets: LTV:CAC of 3:1 or better, CAC payback under 12 months, gross margin above 75 percent, monthly churn under 3 percent.
• India twist: report MRR net of Goods and Services Tax (GST), plan cash around Tax Deducted at Source (TDS), and treat annual prepaid plans as deferred revenue.
• Want a finance partner to build and run the dashboard? A virtual CFO sets this up in weeks, not quarters.

You raised a round, or you are bootstrapping hard. Either way, money questions keep you up at night. Which numbers actually matter? This guide lists the 15 saas financial metrics every founder must track, with India-specific math, rupee examples, and 2026 benchmarks. No jargon, no fluff.
Most metric guides are written for the United States. They ignore GST, TDS, and the Indian financial year. We fixed that. Every example below uses Indian Rupees (Rs) and the rules that apply to an Indian software company in FY 2025-26.
A SaaS business is a subscription machine. Cash comes in slowly, month after month, while costs hit up front. So a profit-and-loss statement alone hides the truth. You need recurring-revenue metrics to see if the machine is healthy.
Investors think the same way. When you raise funds, they ask for MRR, churn, and burn before they ask for profit. Tracking the right numbers also keeps you ready for board meetings, due diligence, and your annual filings with the Ministry of Corporate Affairs.
:check_mark_button: Founder tip: Pick a small set of metrics, review them every month on the same date, and trend them over time. A number means little on its own. The direction over six months tells the real story.
We group the 15 metrics into three simple buckets. Revenue metrics show how fast you grow. Unit economics show if each customer pays off. Cash metrics show how long you can keep going. A healthy SaaS firm scores well in all three.
Revenue (1-5): MRR, ARR, ARPU, revenue growth rate, and expansion revenue.
Unit economics (6-11): CAC, CAC payback, LTV, LTV:CAC ratio, gross margin, and churn rate.
Cash and efficiency (12-15): Net Revenue Retention, burn rate, runway, and the Rule of 40.
Start with revenue. These five tell you how much predictable money flows in and how fast it grows.
Monthly Recurring Revenue (MRR). The predictable revenue you bill every month. Count only recurring subscription fees, not one-time setup charges.
Annual Recurring Revenue (ARR). MRR multiplied by 12. Use ARR once you cross roughly Rs 1 crore in yearly recurring revenue.
Average Revenue Per User (ARPU). MRR divided by the number of paying accounts. It shows your pricing power.
Revenue growth rate. The percentage rise in MRR or ARR over a period. Early-stage Indian SaaS firms often target 100 percent year over year.
Expansion revenue. Extra money from existing customers who upgrade or buy add-ons. The cheapest growth you can get.
 Watch out: In India a customer may pay Rs 11,800 plus Rs 2,124 GST at 18 percent, so Rs 13,924 lands in your bank. Your true MRR is Rs 11,800, not Rs 13,924. Always report revenue net of GST. The GST portion belongs to the government, and you pay it via your return on the GST portal.
MRR is the heartbeat of your business, so get it right. Break it into four moving parts each month: new, expansion, contraction, and churned. The table below shows a simple month for an Indian SaaS startup. All figures are net of GST.
MRR component | What it means | Example (Rs) |
Starting MRR | MRR at the start of the month | 10,00,000 |
New MRR | From brand-new paying customers | +1,50,000 |
Expansion MRR | Upgrades from existing customers | +60,000 |
Contraction MRR | Downgrades to cheaper plans | -40,000 |
Churned MRR | Lost to cancellations | -70,000 |
Net new MRR | New + Expansion - Contraction - Churned | +1,00,000 |
Ending MRR | MRR at the end of the month | 11,00,000 |
Here the company added Rs 1,00,000 in net new MRR, a 10 percent rise. That single view tells you more than a whole profit-and-loss sheet. If you sell yearly prepaid plans, do not book the full amount in one month. Spread it across 12 months as deferred revenue, which we cover below.
Revenue can grow while you quietly lose money on every sale. Unit economics catch that. These six metrics decide whether your growth is healthy or a trap.
Customer Acquisition Cost (CAC). Total sales and marketing spend divided by new customers won in the same period.
CAC payback period. Months of gross profit needed to earn back the CAC. Aim for under 12 months.
Customer Lifetime Value (LTV). The total gross profit you expect from one customer before they leave.
LTV:CAC ratio. LTV divided by CAC. A ratio of 3:1 or better is the healthy zone.
Gross margin. Revenue minus the direct cost of serving customers, like hosting and support. Target above 75 percent.
Churn rate. The percentage of customers or revenue you lose in a period. Keep monthly churn under 3 percent.
Getting these right is exactly where a virtual CFO earns their keep. They build the model, set the targets, and flag the leaks before they sink your runway.
Numbers need a yardstick. The table below gives healthy 2026 targets for Indian SaaS startups. Treat them as goalposts, not pass-or-fail lines. Early-stage firms get a little slack on payback and burn.
Metric | Healthy 2026 target | Red flag |
LTV:CAC ratio | 3:1 to 5:1 | Below 3:1 |
CAC payback | Under 12 months | Over 18 months |
Gross margin | Above 75 percent | Below 60 percent |
Monthly churn | Under 3 percent | Above 7 percent |
Net Revenue Retention | Above 110 percent | Below 100 percent |
Burn multiple | 1.0x or lower | Above 2.5x |
Rule of 40 score | 40 percent or more | Below 20 percent |
 Note: Even strong public SaaS companies often miss these. The median Rule of 40 score across listed SaaS firms is around 28 percent. So do not panic if you are not perfect. Aim to improve the trend each quarter.
Cash is oxygen. You can have great revenue and still die if you run out. These last four metrics tie growth back to survival.
Net Revenue Retention (NRR). Revenue from existing customers this year versus last year, including upgrades and churn. Above 100 percent means you grow even with zero new sales.
Burn rate. The net cash you spend each month. Track gross burn and net burn separately.
Runway. Cash in bank divided by monthly net burn. It tells you how many months you have left.
Rule of 40. Your growth rate plus your profit margin. A score of 40 or more signals a balanced, fundable business.
Watch out: Indian clients deduct TDS, often 2 percent or 10 percent, before paying you. If you bill Rs 10,00,000, you may receive Rs 9,80,000 in cash while Rs 20,000 sits as a credit you claim later. Plan runway on actual cash received, then reconcile TDS through your Form 26AS on the Income Tax portal.
This is where India-specific guides earn their place. Three things change how you read your SaaS numbers in India.
GST on subscriptions. SaaS sold within India usually attracts 18 percent GST. Report MRR and ARR net of GST so your growth numbers stay honest.
TDS on receipts. Business customers deduct TDS before paying. Your cash inflow is lower than your invoice, so build that gap into your runway model.
Deferred revenue. When a customer prepays for a year, that cash is a liability until you deliver the service. Recognise one-twelfth as revenue each month.
Selling SaaS to overseas customers can qualify as an export of services, which may be zero-rated under GST. The rules around the Reserve Bank of India and foreign receipts are detailed, so check guidance from the Reserve Bank of India and get a professional to confirm your treatment. Clean bookkeeping makes all of this far easier at year end.
Not every number deserves a dashboard slot. Some look great in a pitch but tell you little about the health of the business. Watch these with care, and never let them replace the core five.
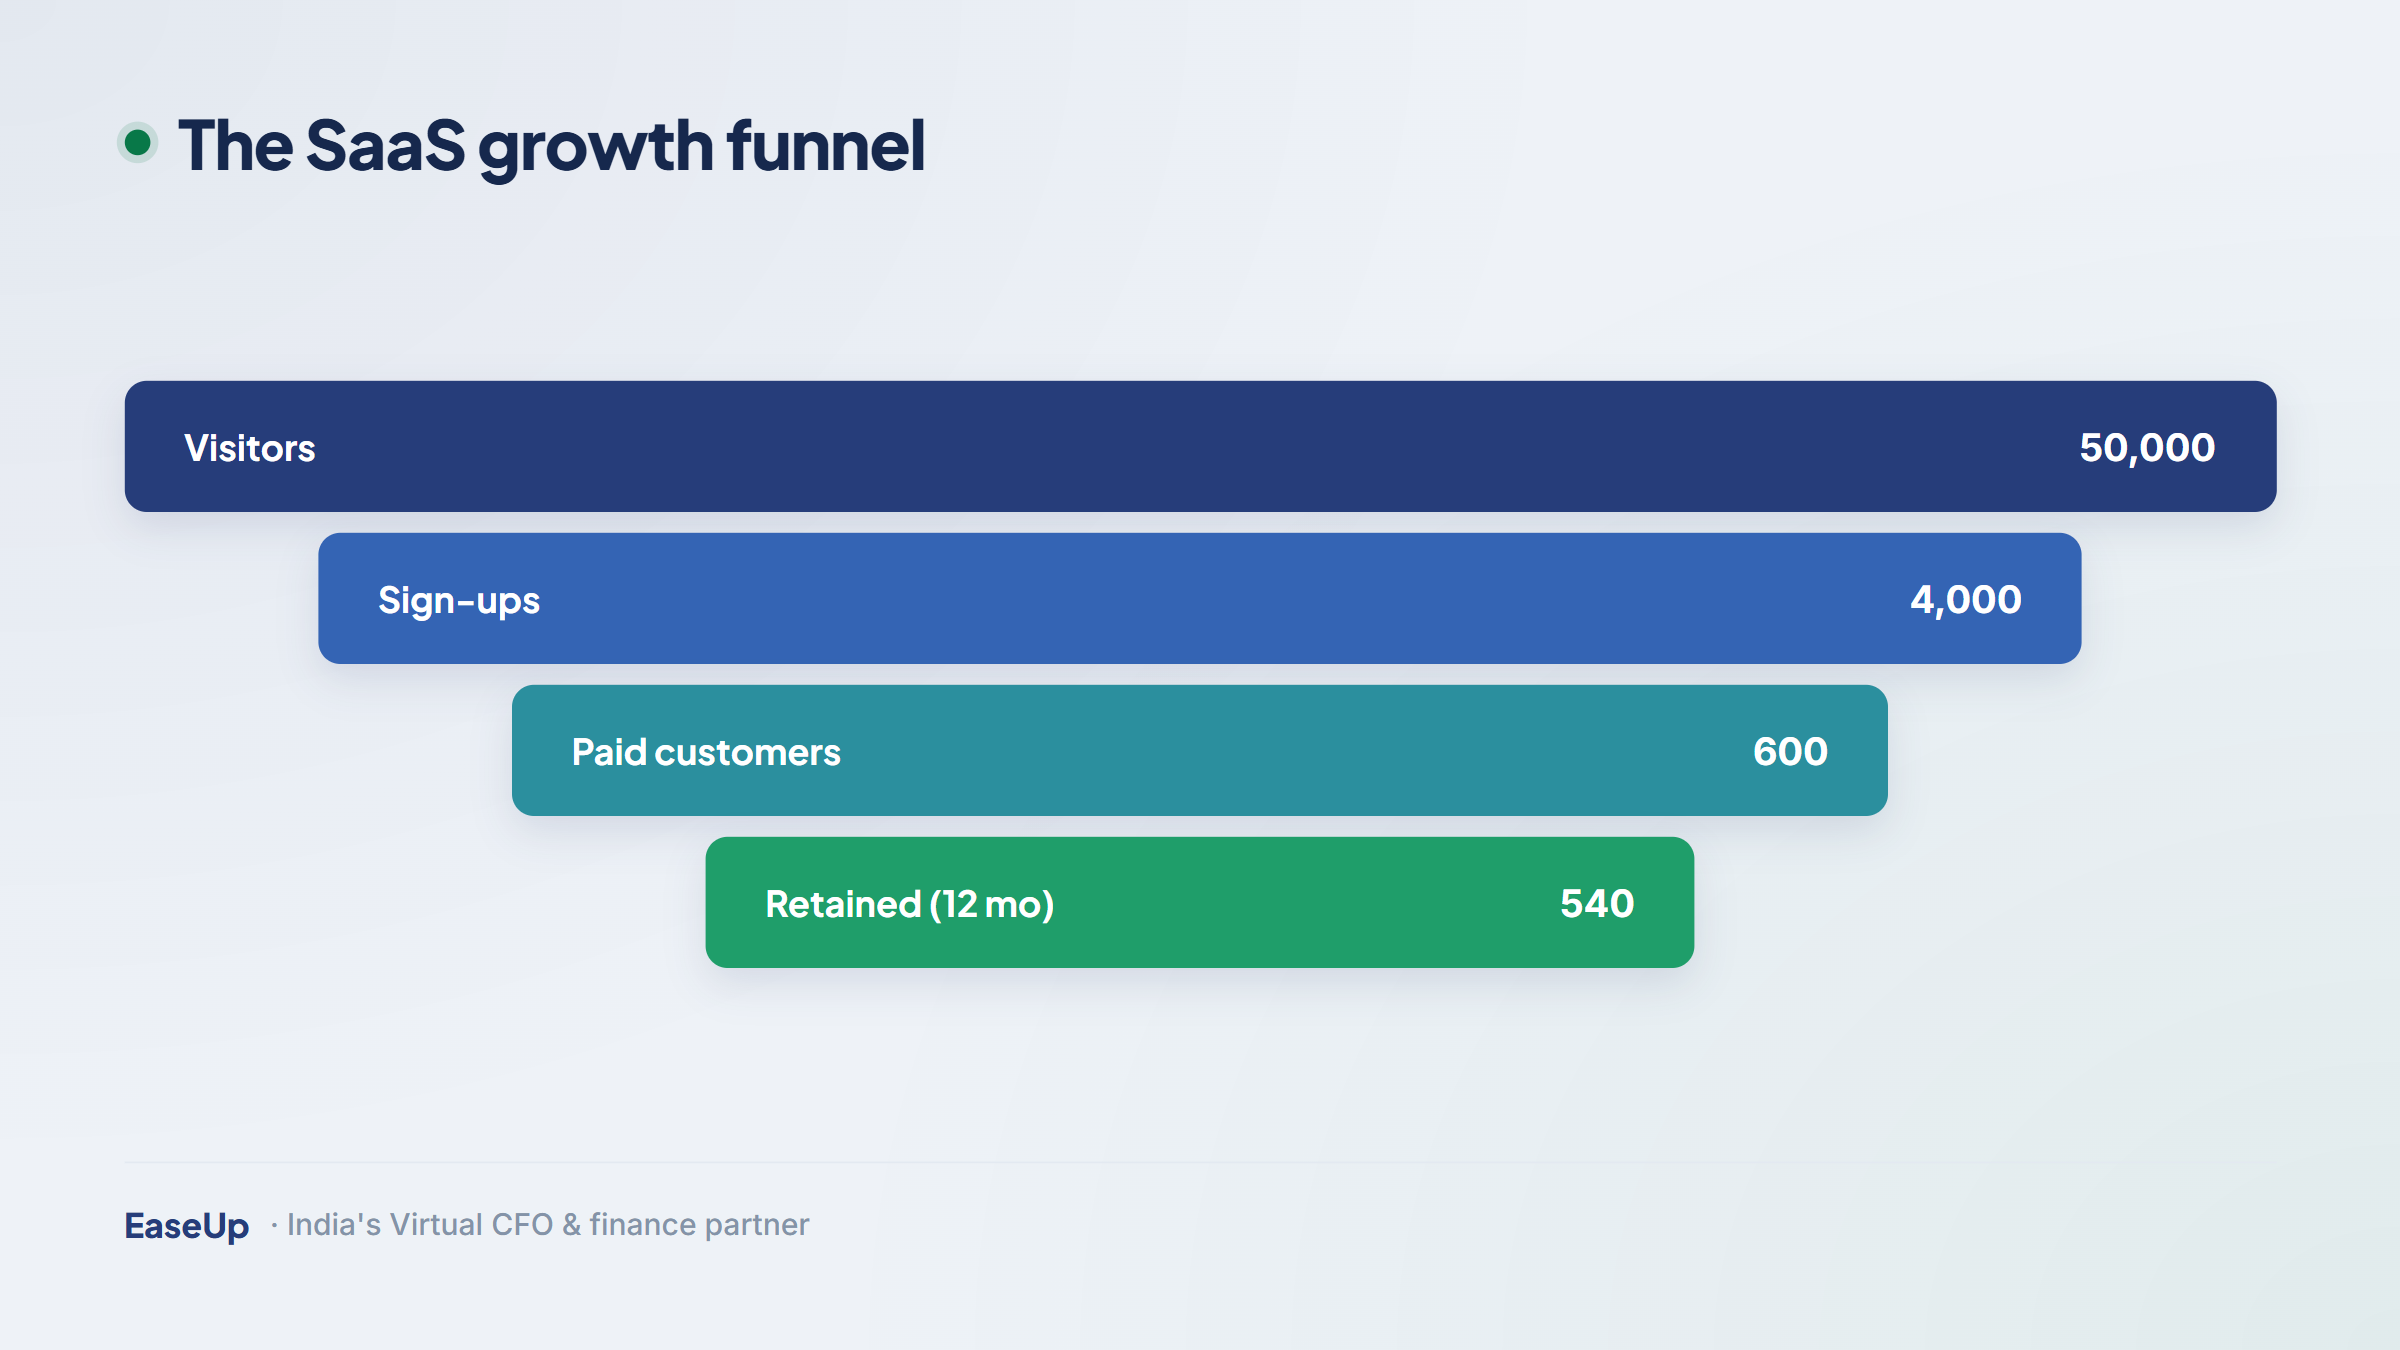
Total signups. Free signups feel good but mean nothing until they pay and stay.
App downloads. A download is not a paying customer.
Total registered users. A big number that includes dead accounts hides your real, active base.
Page views. Useful for marketing, but a weak proxy for revenue.
You do not need all 15 from day one. Match the metrics to your stage so you do not drown in dashboards.
Pre-revenue to early. Focus on MRR growth, burn, and runway. Survival first.
Product-market fit. Add churn, CAC, and CAC payback. Prove the model works.
Scaling and fundraising. Layer in LTV:CAC, NRR, gross margin, and the Rule of 40. Investors will ask.
If building this feels like a second job, it is. Many founders hand the finance stack to a part-time virtual CFO and get back to product. Add fundraising support when a round is near and your metrics need to tell a tight story.
You do not need fancy software to start. A clean spreadsheet, updated monthly, beats a costly tool you never open. Build it in three steps.
Pull clean data. Export billing and bank data, strip out GST, and adjust for deferred revenue.
Pick your dozen. Choose the metrics that fit your stage from the buckets above.
Review on a fixed date. Same day every month, compare to last month, and write one line on what changed and why.
:check_mark_button: Founder tip: Set a single source of truth for revenue. If your billing tool, your spreadsheet, and your accountant disagree, fix that first. Conflicting numbers destroy trust in a board meeting.
Metrics are only useful if someone watches them, explains them, and acts on them. That is the job of a finance partner. EaseUp gives Indian founders and SME owners a virtual CFO who builds your dashboard, handles GST and TDS, and turns numbers into decisions, all for a fraction of a full-time hire.
Whether you are bootstrapped or VC-backed, you deserve clear numbers you can trust. Book a free call and we will review your current metrics with you.
Start with five: Monthly Recurring Revenue (MRR), Annual Recurring Revenue (ARR), Net Revenue Retention (NRR), Customer Acquisition Cost (CAC), and runway. These show growth, the value of your existing base, the cost of new sales, and how long your cash lasts. In India, always report MRR and ARR net of Goods and Services Tax so your growth numbers stay honest.
GST inflates the cash you receive, so strip the 18 percent out before you count revenue. If a customer pays Rs 13,924 with GST, your true MRR is Rs 11,800. TDS does the opposite: business clients deduct tax before paying you, so your bank inflow is lower than your invoice. Plan runway on actual cash received, and reconcile TDS later through Form 26AS on the Income Tax portal.
A healthy LTV:CAC ratio sits between 3:1 and 5:1. Below 3:1 means you spend too much to win each customer, or they leave too soon. Far above 5:1 can mean you are underspending on growth. Pair the ratio with a CAC payback period under 12 months so you know you recover the cost quickly, not over many years.
Use deferred revenue accounting. When a customer prepays for a year, the cash arrives at once but you have not earned it yet. Record it as a liability and recognise one-twelfth as revenue each month as you deliver the service. This keeps your MRR accurate and stops a single big payment from making one month look like a spike.
Early on you can run a clean spreadsheet yourself, updated monthly. As you scale, raise funds, or face GST, TDS, and deferred revenue questions, a part-time or virtual CFO saves time and prevents costly mistakes. They build the dashboard, set targets, handle compliance, and explain the numbers to your board, usually for a fraction of a full-time hire.
This article is for general information only and is not tax, accounting, or legal advice. Rules under GST, income tax, and company law change often, so please consult a qualified professional before acting on anything here.


Your trusted partner for all your Financial needs.


Finance Management
Strategic Services