TL;DR — Reading a P&L in one minute
• Run four quick checks: revenue quality, gross margin, operating costs and profit quality. Together they tell you if growth is real and profit comes from the core business.
• In India the P&L follows the Schedule III vertical format, which splits Revenue from Operations from Other Income. Read them separately.
• Use vertical analysis (every line as a % of revenue) to see cost structure, and horizontal analysis (period on period) to spot cost creep.
• Watch for red flags: margin compression, Other Income carrying PAT, and finance-cost spikes. They rarely survive due diligence.
• The fix is a disciplined monthly review — margins, ratios and variances, tracked every month, not once a year.
An income statement — your profit and loss (P&L) — shows how revenue became profit over a period. Analysing it is not about staring at the bottom line. It is about asking where the profit came from and whether it will last.
Start with four checks: revenue quality, gross margin, operating costs and profit quality. For an Indian founder, these quickly reveal whether growth is real, costs are under control, and profit is coming from core operations rather than one-off items.
Do this well and the P&L stops being a compliance document. It becomes a decision tool for pricing, hiring and cash flow. If your books are behind, though, no analysis will help — clean bookkeeping comes first.
 Founder tip: Read the P&L top to bottom, not bottom to top. Founders who jump straight to PAT miss the story the margins are telling them higher up.
In India the P&L follows a vertical format mandated by Schedule III to the Companies Act, 2013. Unlike generic global templates, it strictly separates Revenue from Operations from Other Income such as interest or gains on investments.
Knowing this order matters, because analysis flows from the top down.
Line in the P&L | What sits here | Why it matters |
Revenue from Operations | Core business sales, shown net of GST | The real top line — the base for every ratio |
Other Income | Interest, gains, incidental receipts | Non-core; must never be mistaken for operating revenue |
Total Income | Revenue from Operations + Other Income | A combined figure — always split it back out |
Expenses | COGS, employee benefits, finance costs, depreciation | Where cost structure and efficiency show up |
Profit Before Tax (PBT) | Income minus all expenses | Operating and financing performance combined |
Tax Expense | Current + deferred tax | Deferred tax often distorts the true charge |
Profit After Tax (PAT) | The true bottom line | The number investors and owners actually keep |
You can see the statutory format and disclosures on the Ministry of Corporate Affairs portal.
Before any ratio, confirm the top line is honest. Two questions do most of the work.
Is it net of GST? Revenue must exclude GST collected. If tax is mixed into sales, the top line looks inflated and every margin below it is wrong.
Is it classified correctly? Core sales belong in Revenue from Operations. Interest and one-off gains belong in Other Income, never the top line.
GST is a pass-through you collect for the government, not your money. You can confirm the rules on the official GST portal. When these basics are wrong, growth stories fall apart under scrutiny.
Vertical analysis — also called common-size analysis — turns every line into a percentage of revenue. It lets you spot inefficiencies early, before they eat into your cash runway.
The most useful check is gross margin against sector norms. If your numbers sit far off the benchmark, dig in.
Business type | Typical gross margin | What a miss usually signals |
SaaS | 70%+ | COGS near 40% often points to an inefficient cloud or server setup |
D2C | 35–50% | Below range usually means discounting or high logistics cost |
Services | 25–40% | Thin margins point to underpricing or bench idle time |
:info: Why common-size helps: Percentages let you compare a ₹2 crore business with a ₹200 crore one on the same scale. A line that grows as a share of revenue year on year is where your margin is leaking.
Horizontal analysis compares one period with another. It shows whether revenue, margins and costs are moving in the right direction. For founders it is the fastest way to catch cost creep and weak operating leverage — as long as bookkeeping is current.
The classic warning sign is the growth trap. If revenue rises 20% but employee benefit expense rises 40%, you are adding cost faster than output. That points to weaker unit economics or hiring ahead of revenue.
 Watch out: ESOP expense is non-cash, but it still belongs in the P&L under Ind AS 102. Leaving it out makes EBITDA look stronger than it is and creates friction during due diligence or a fundraise.
Gross margin is the profit left after direct costs, as a share of revenue. It shows how efficiently the business delivers what it sells — and it is the hardest line to fake.
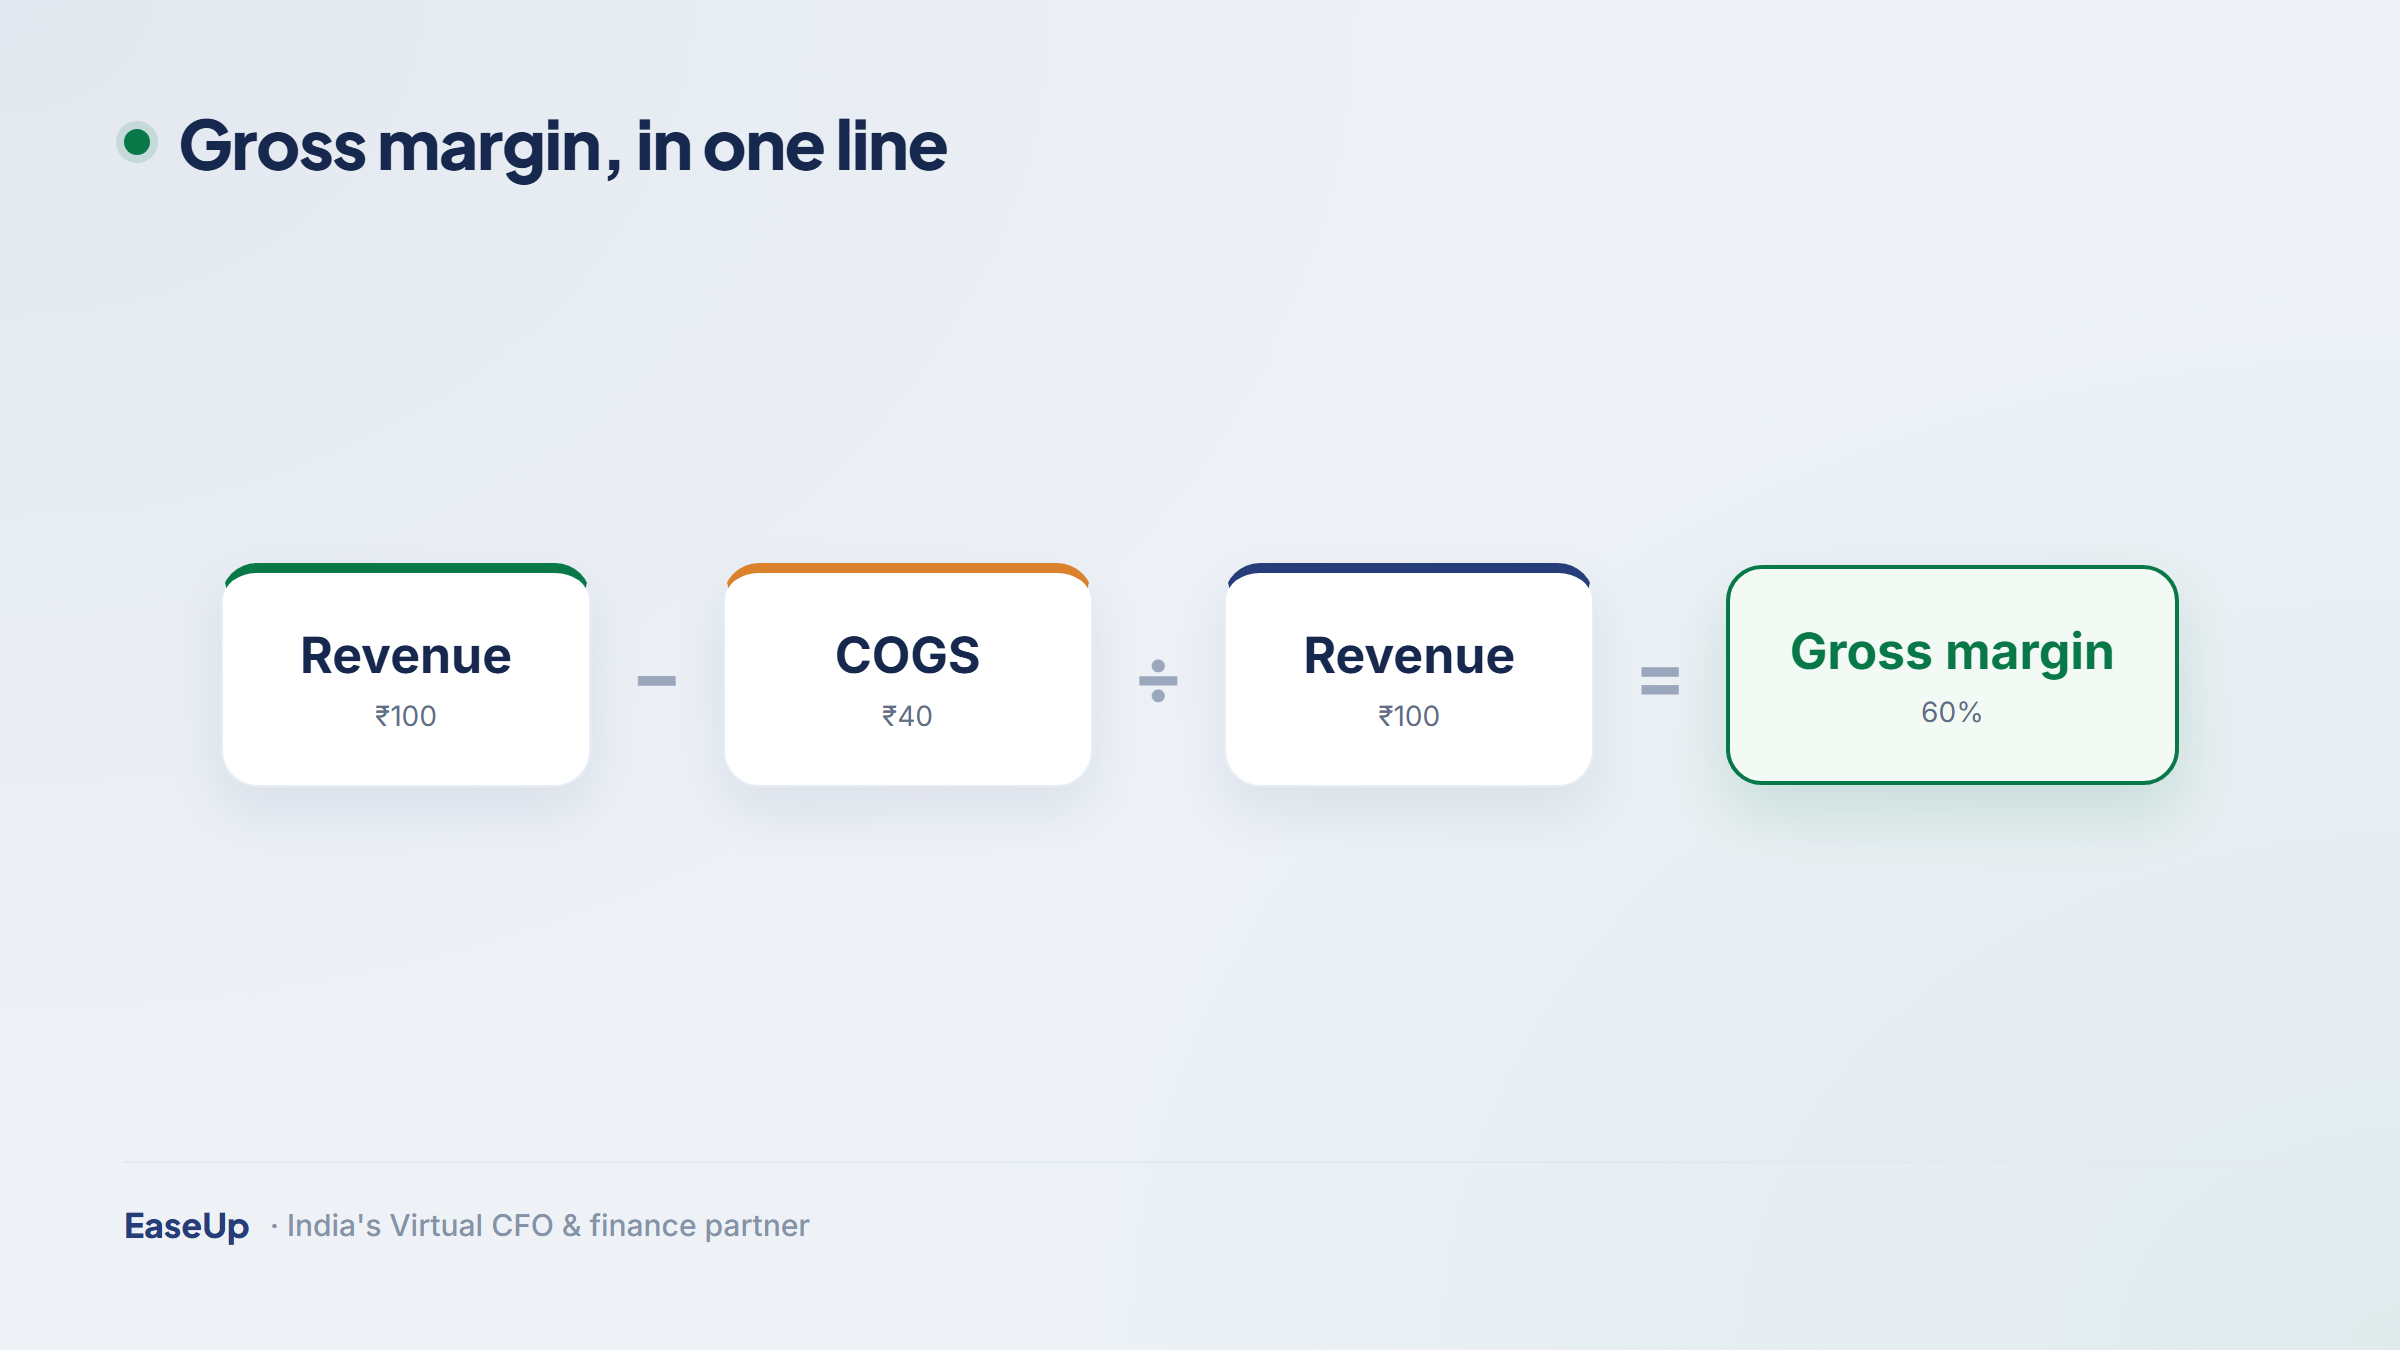
Say a business books ₹100 of revenue and ₹40 of direct cost (COGS). The gross profit is ₹60, so the gross margin is ₹60 ÷ ₹100 = 60%. Track this every month. A margin that quietly slips from 60% to 52% is a bigger warning than a small dip in revenue.
Investors rarely stop at PAT. They read efficiency ratios that reveal how well the business converts revenue into durable profit.
Ratio | What it shows |
Gross margin | How efficiently you deliver what you sell |
EBITDA margin | Operating profit before non-cash and financing items |
Opex ratio | How much revenue operating costs consume |
Contribution margin | What is left after variable costs |
Rule of 40 | Revenue growth % + profit margin % — a health check for SaaS; 40%+ is strong |
Burn multiple | How much cash you burn to add each rupee of new ARR — lower is better |
You do not need all six every month. Pick the three or four that fit your model, and track them as a trend. A virtual CFO can set the right ratio dashboard for your stage.
Two businesses can report the same PAT and be worlds apart. The question is where that profit came from.
Operating PAT is earned from core sales and normal costs. It is repeatable and it compounds.
Propped-up PAT leans on Other Income, one-off gains or capitalised costs. It flatters this year and disappears next year.
If Other Income is carrying your bottom line, the underlying business may be weaker than the headline suggests. That is exactly what a buyer or lender will test first.
A few patterns reliably signal that a deeper review is coming. Catch them before an investor or auditor does.
Gross margin compression: revenue rises but gross margin falls — pricing or cost discipline is slipping.
Other Income carrying PAT: non-operating income is propping up reported profit.
Finance-cost spikes: borrowing pressure or working-capital stress is building.
Capitalised R&D: costs get pushed off the P&L to flatter profitability.
When several of these show up together, expect an accounting and compliance review to take longer and ask harder questions.
Even careful founders trip on the same three things.
Mistake | Why it hurts |
Ignoring tax-audit thresholds | Under Section 44AB, an audit is mandatory once turnover crosses ₹1 crore (₹10 crore if 95% of receipts and payments are digital) |
Overusing "Miscellaneous Expenses" | Parking 20% of spend in a catch-all reads as black-box accounting and a lack of transparency |
Ignoring deferred tax | Timing differences between accounting and tax rules distort the true tax liability |
The audit thresholds sit in Section 44AB of the Income Tax Act. Keeping an audit-ready P&L all year is far easier than fixing one in September.
The pros do not analyse the P&L once a year. They run a short, structured review every month so drift is caught early.
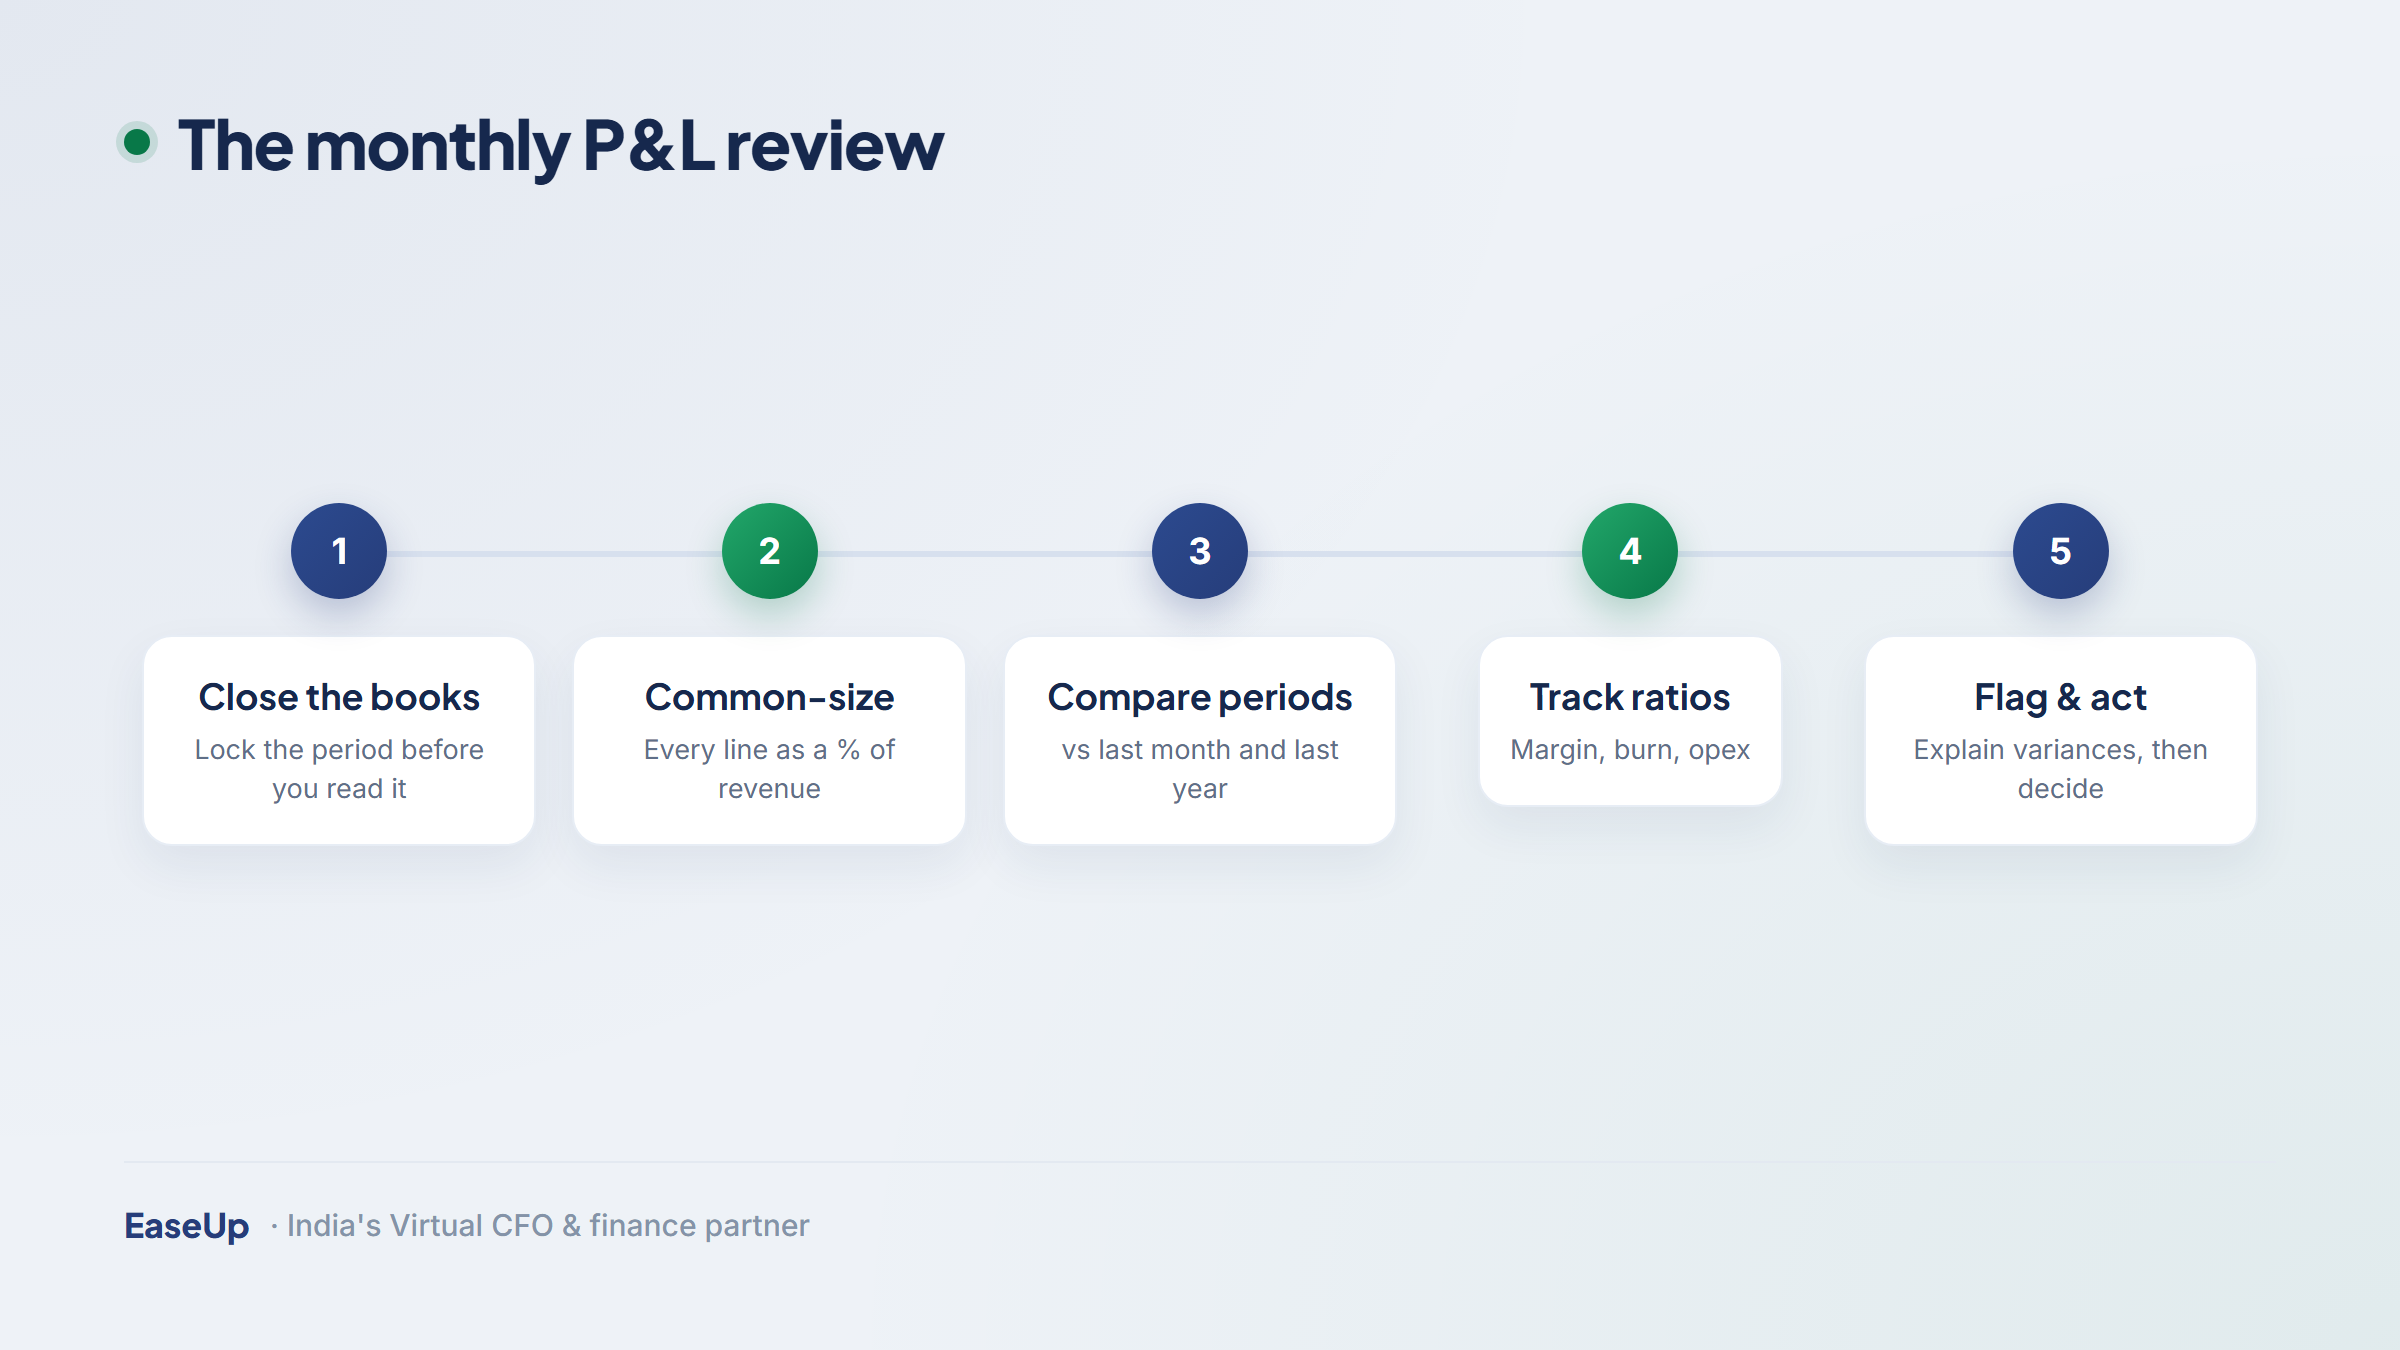
Variance analysis: explain where actual performance moved away from plan.
Ratio tracking: keep margin, burn and operating efficiency visible over time.
Audit readiness: keep disclosures and supporting records in review-ready shape.
Reading a P&L well takes finance judgement, not just formulas. If you are preparing for a raise, worried about margins, or unsure whether your profit is real, expert eyes pay for themselves. A virtual CFO turns your income statement into a monthly decision tool — spotting drift early and keeping you ready for any investor or auditor.
Start with four checks: revenue quality, gross margin, operating costs and profit quality. Together they give a quick read on whether growth is real, margins are healthy, and profit is coming from core operations rather than one-off items. Only after these should you dig into individual line items.
No. Revenue should be shown net of GST. GST is a tax you collect on behalf of the government, not your income. If it is mixed into sales, the top line looks inflated and every margin calculated below it becomes misleading.
Revenue from operations comes from your main business activity. Other income covers non-core items such as interest, gains on investments or incidental receipts. Under Schedule III the two must be shown separately, so that operating performance is not overstated by one-off gains.
Review it every month once the books are closed, then compare it with the prior month and the same month last year. A monthly rhythm catches cost creep and margin slippage early, while an annual-only review usually spots problems far too late to fix cheaply.
Under Section 44AB of the Income Tax Act, a tax audit is mandatory once business turnover exceeds ₹1 crore in a financial year. The threshold rises to ₹10 crore if at least 95% of receipts and payments are digital. Keeping an audit-ready P&L through the year makes meeting these limits far simpler.
This guide is for general information only and does not constitute tax, legal or financial advice. Reporting standards and tax provisions change — confirm the current position with a qualified professional before acting on your income statement.


Your trusted partner for all your Financial needs.


Finance Management
Strategic Services